43 Milwaukee
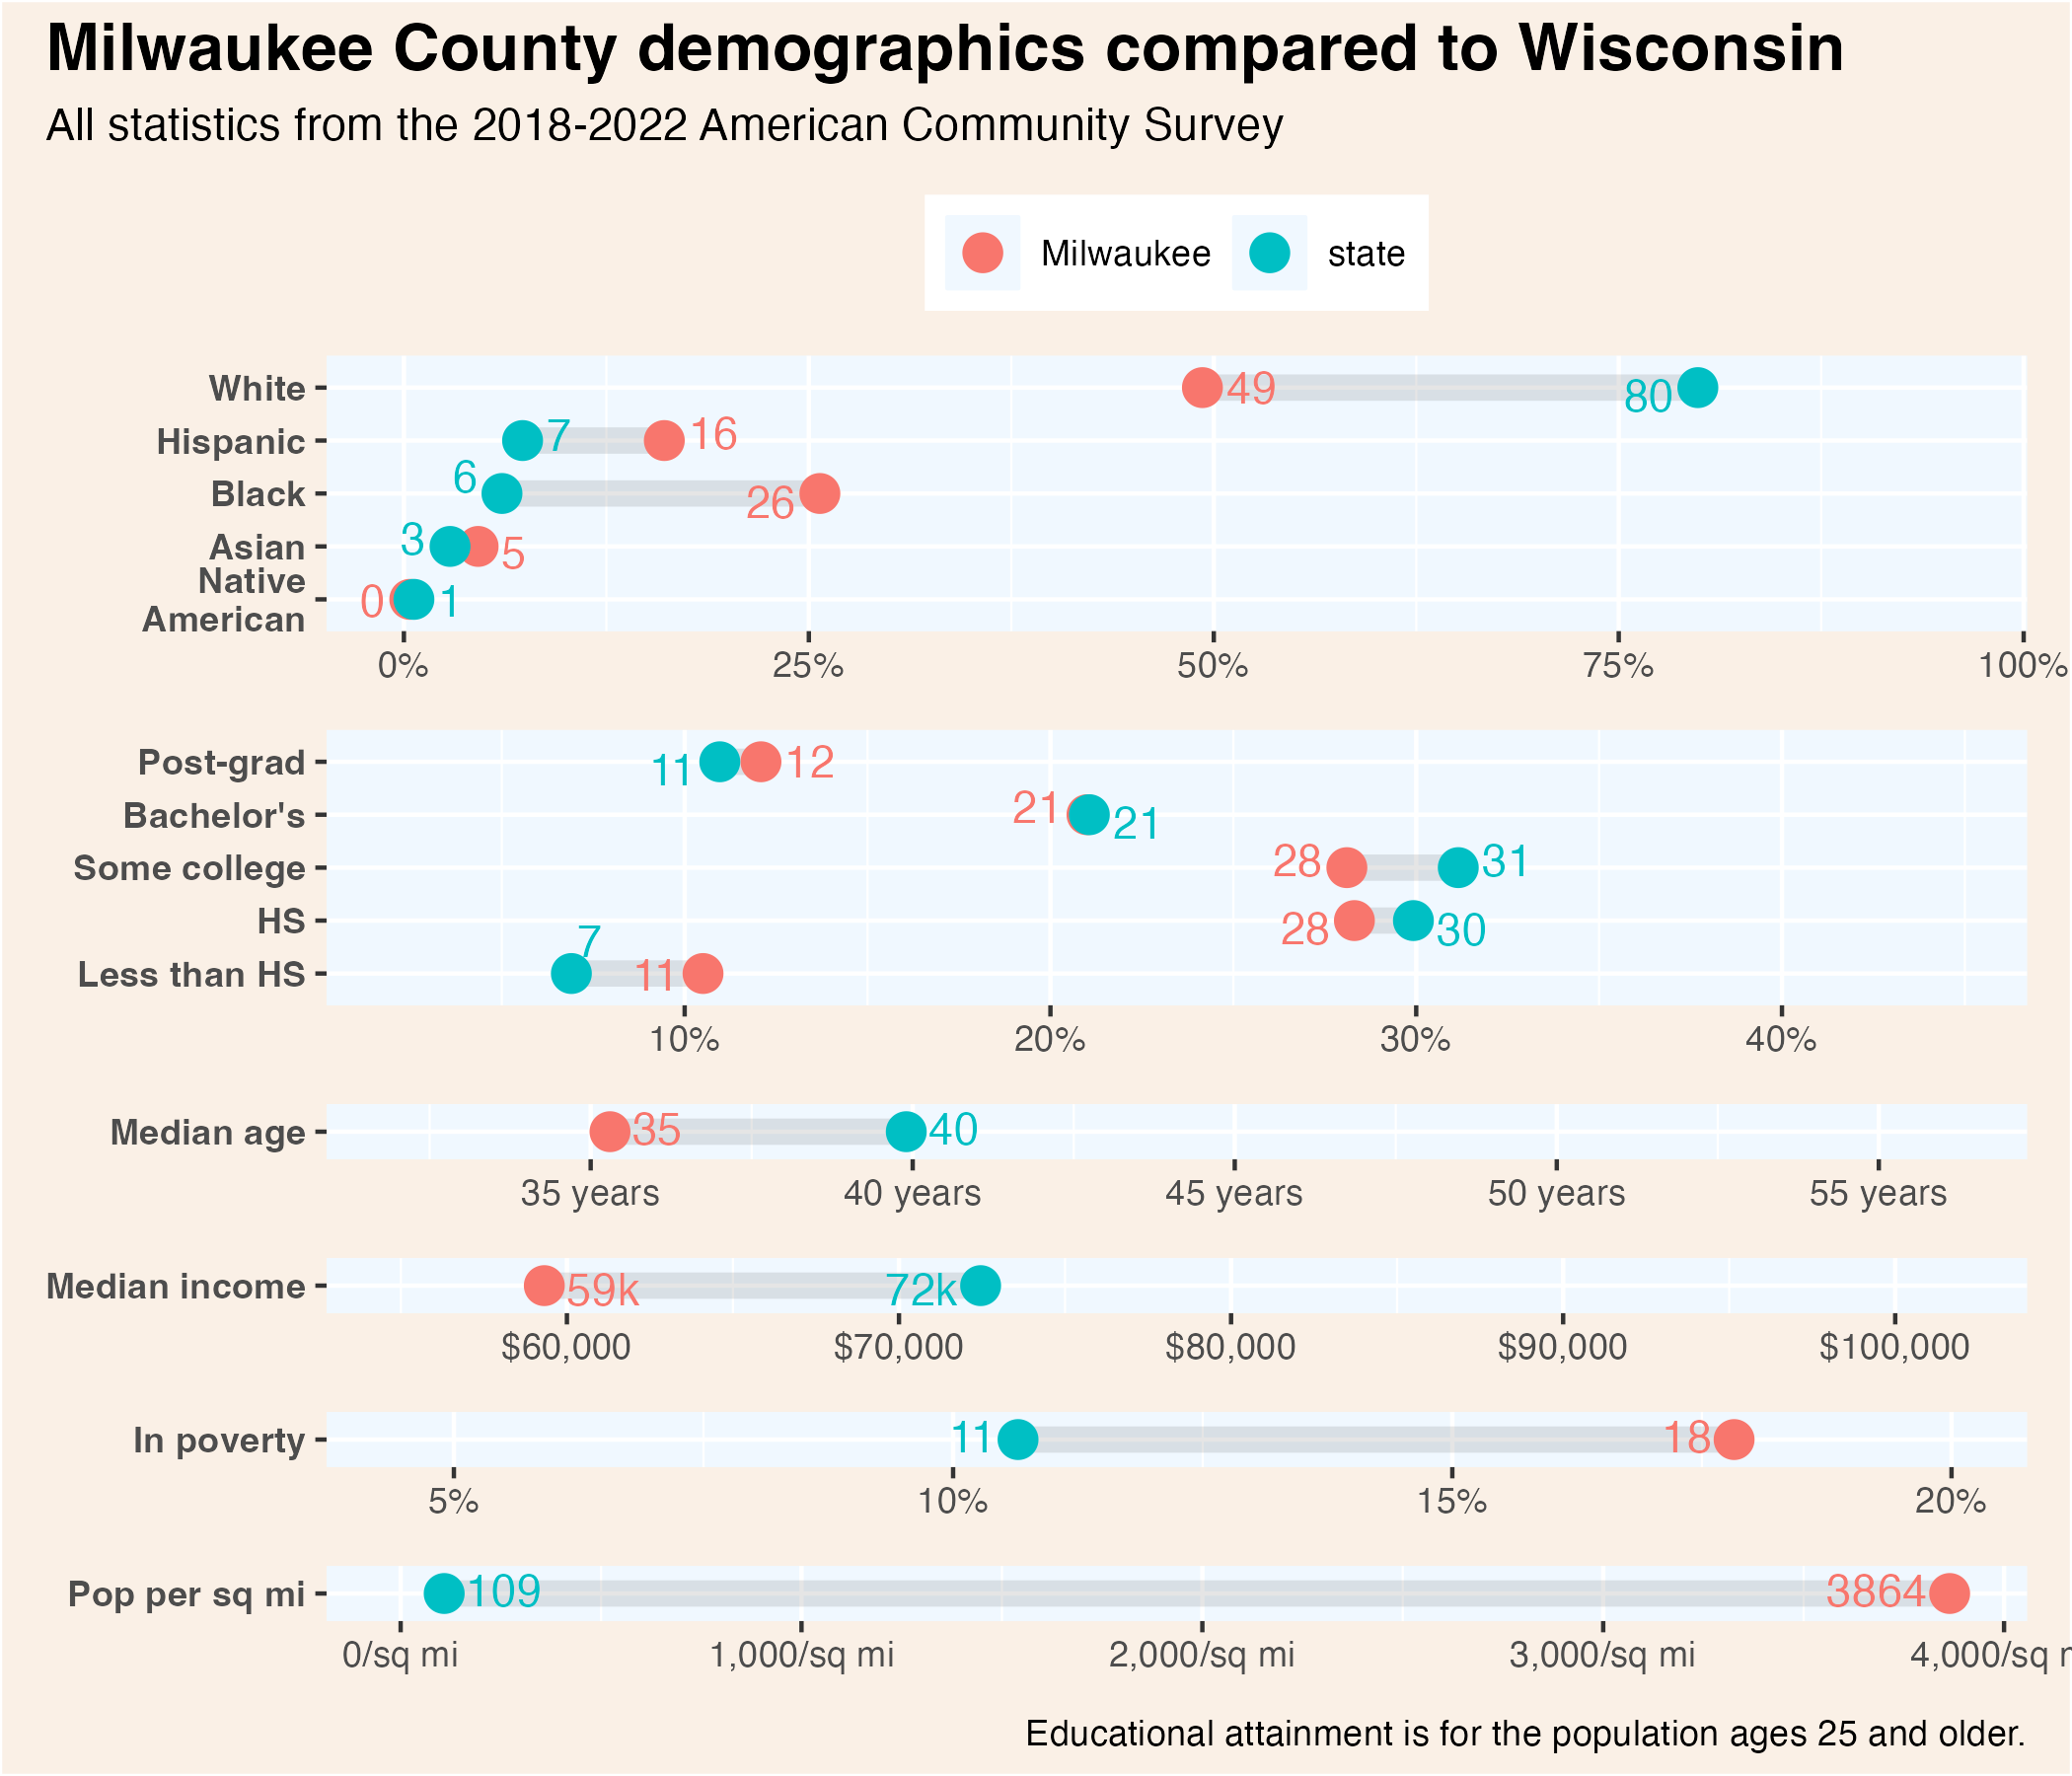
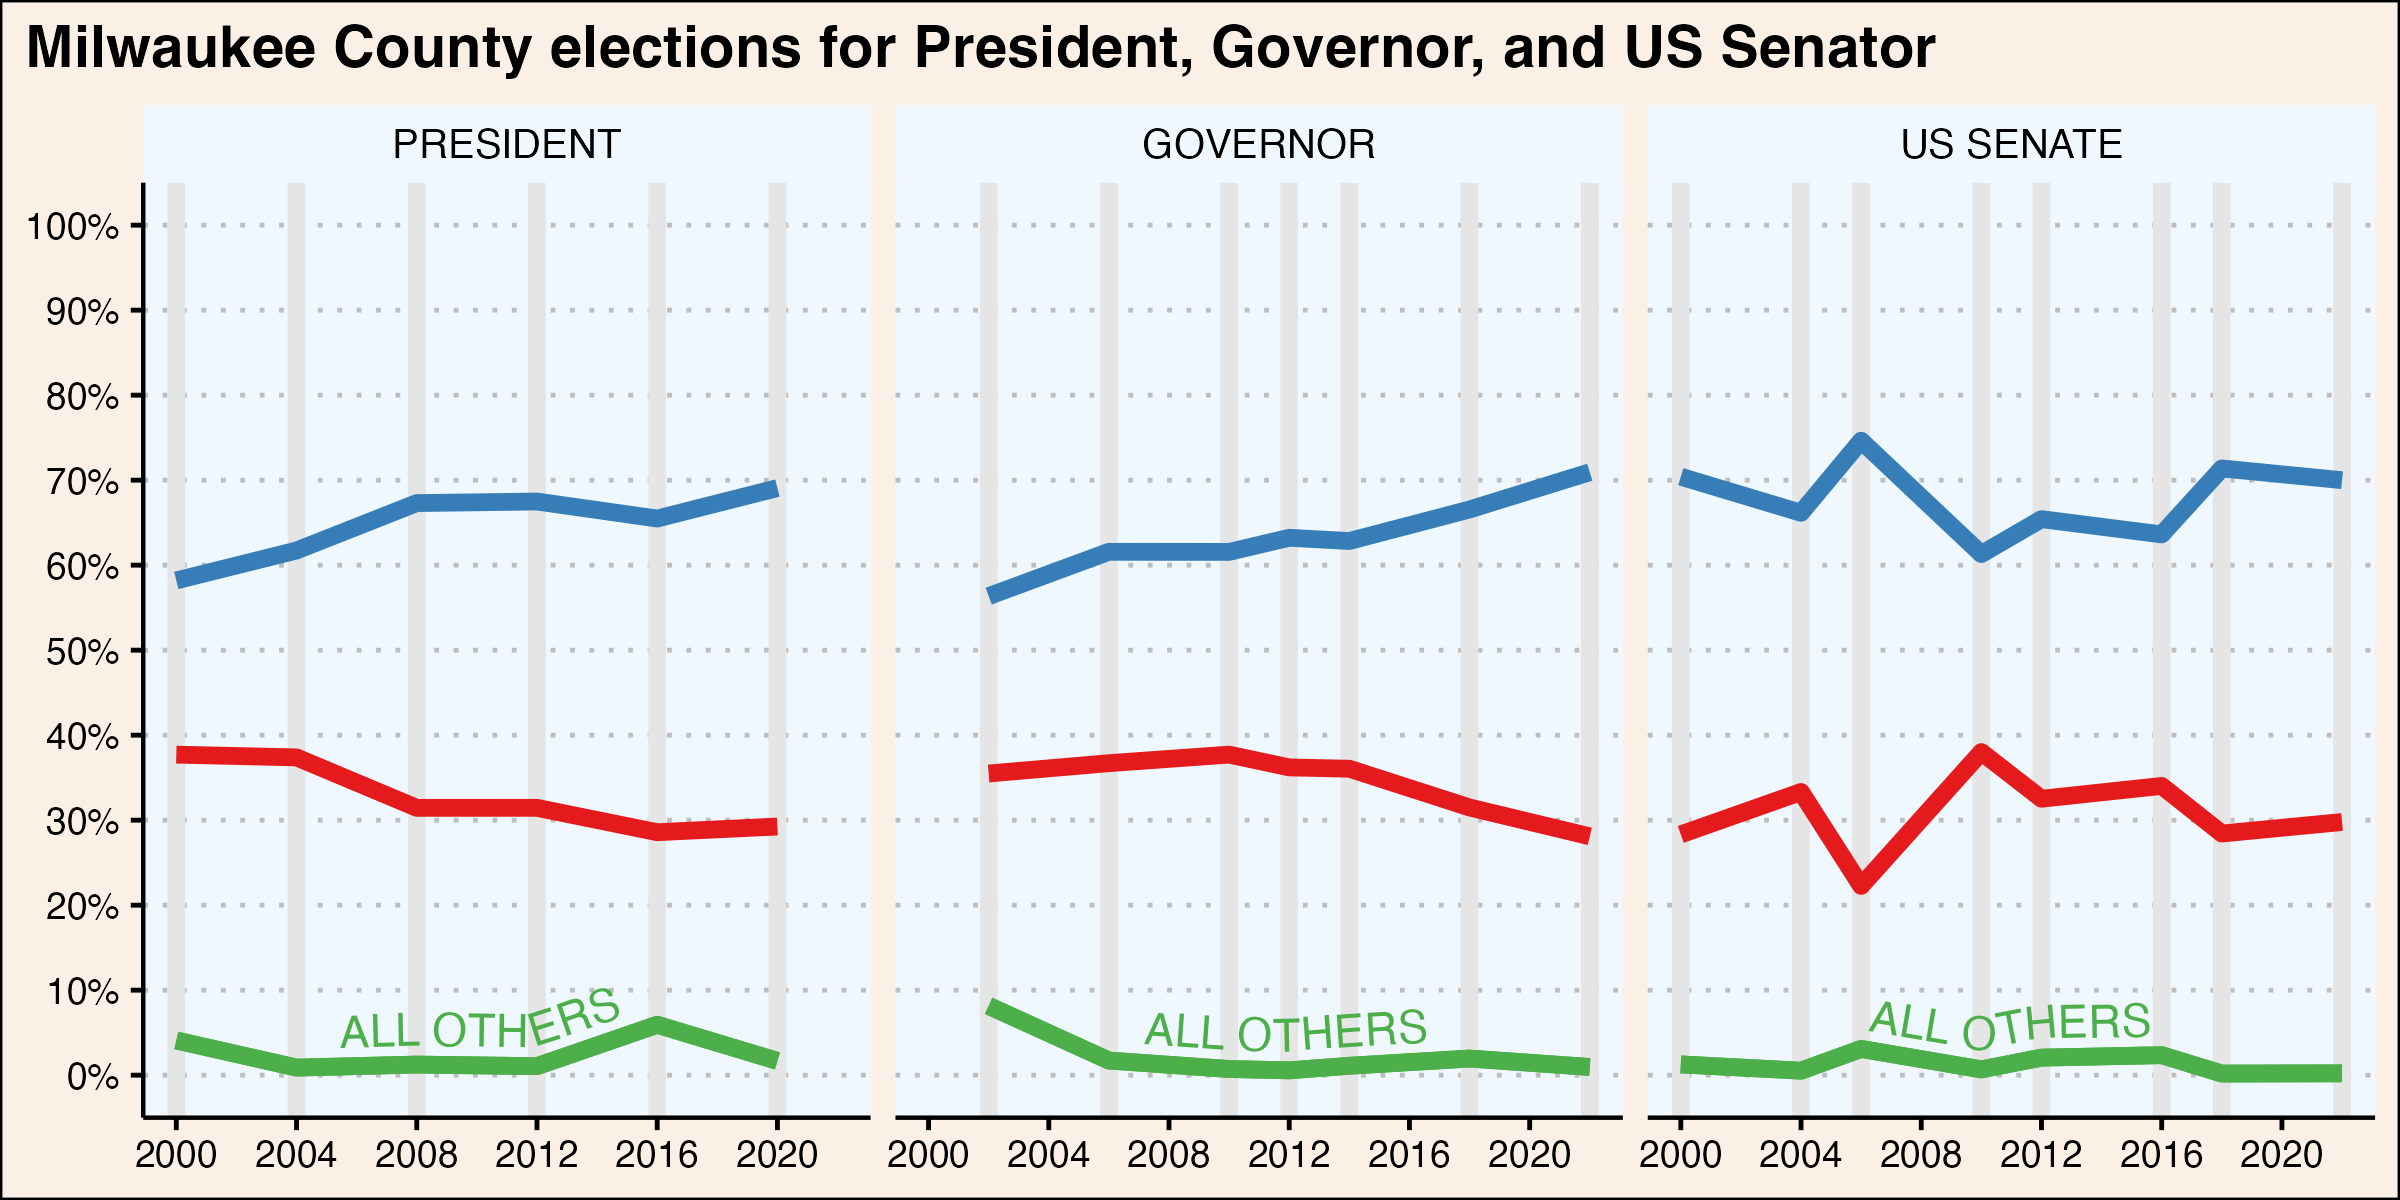
Milwaukee county (pop. 928,000) is, by far, the state’s largest, holding about 16% of Wisconsin’s total population. While internally segregated, the county’s overall population is notably diverse. Non-Hispanic white people make up slightly less than half the county’s population, Black residents 26%, Hispanic or Latino residents 17%, and Asian residents 5%. The county’s median age and income are lower than the state average. Poverty rates are much higher, while educational attainment is similar to the state overall. Politically, the county is a Democratic stronghold. Margins of victory for Demcoratic candidates have increased in recent years.
43.1 Demographics
43.2 County Election Results
Click each column name to sort its values.
43.3 Municipality Election Results
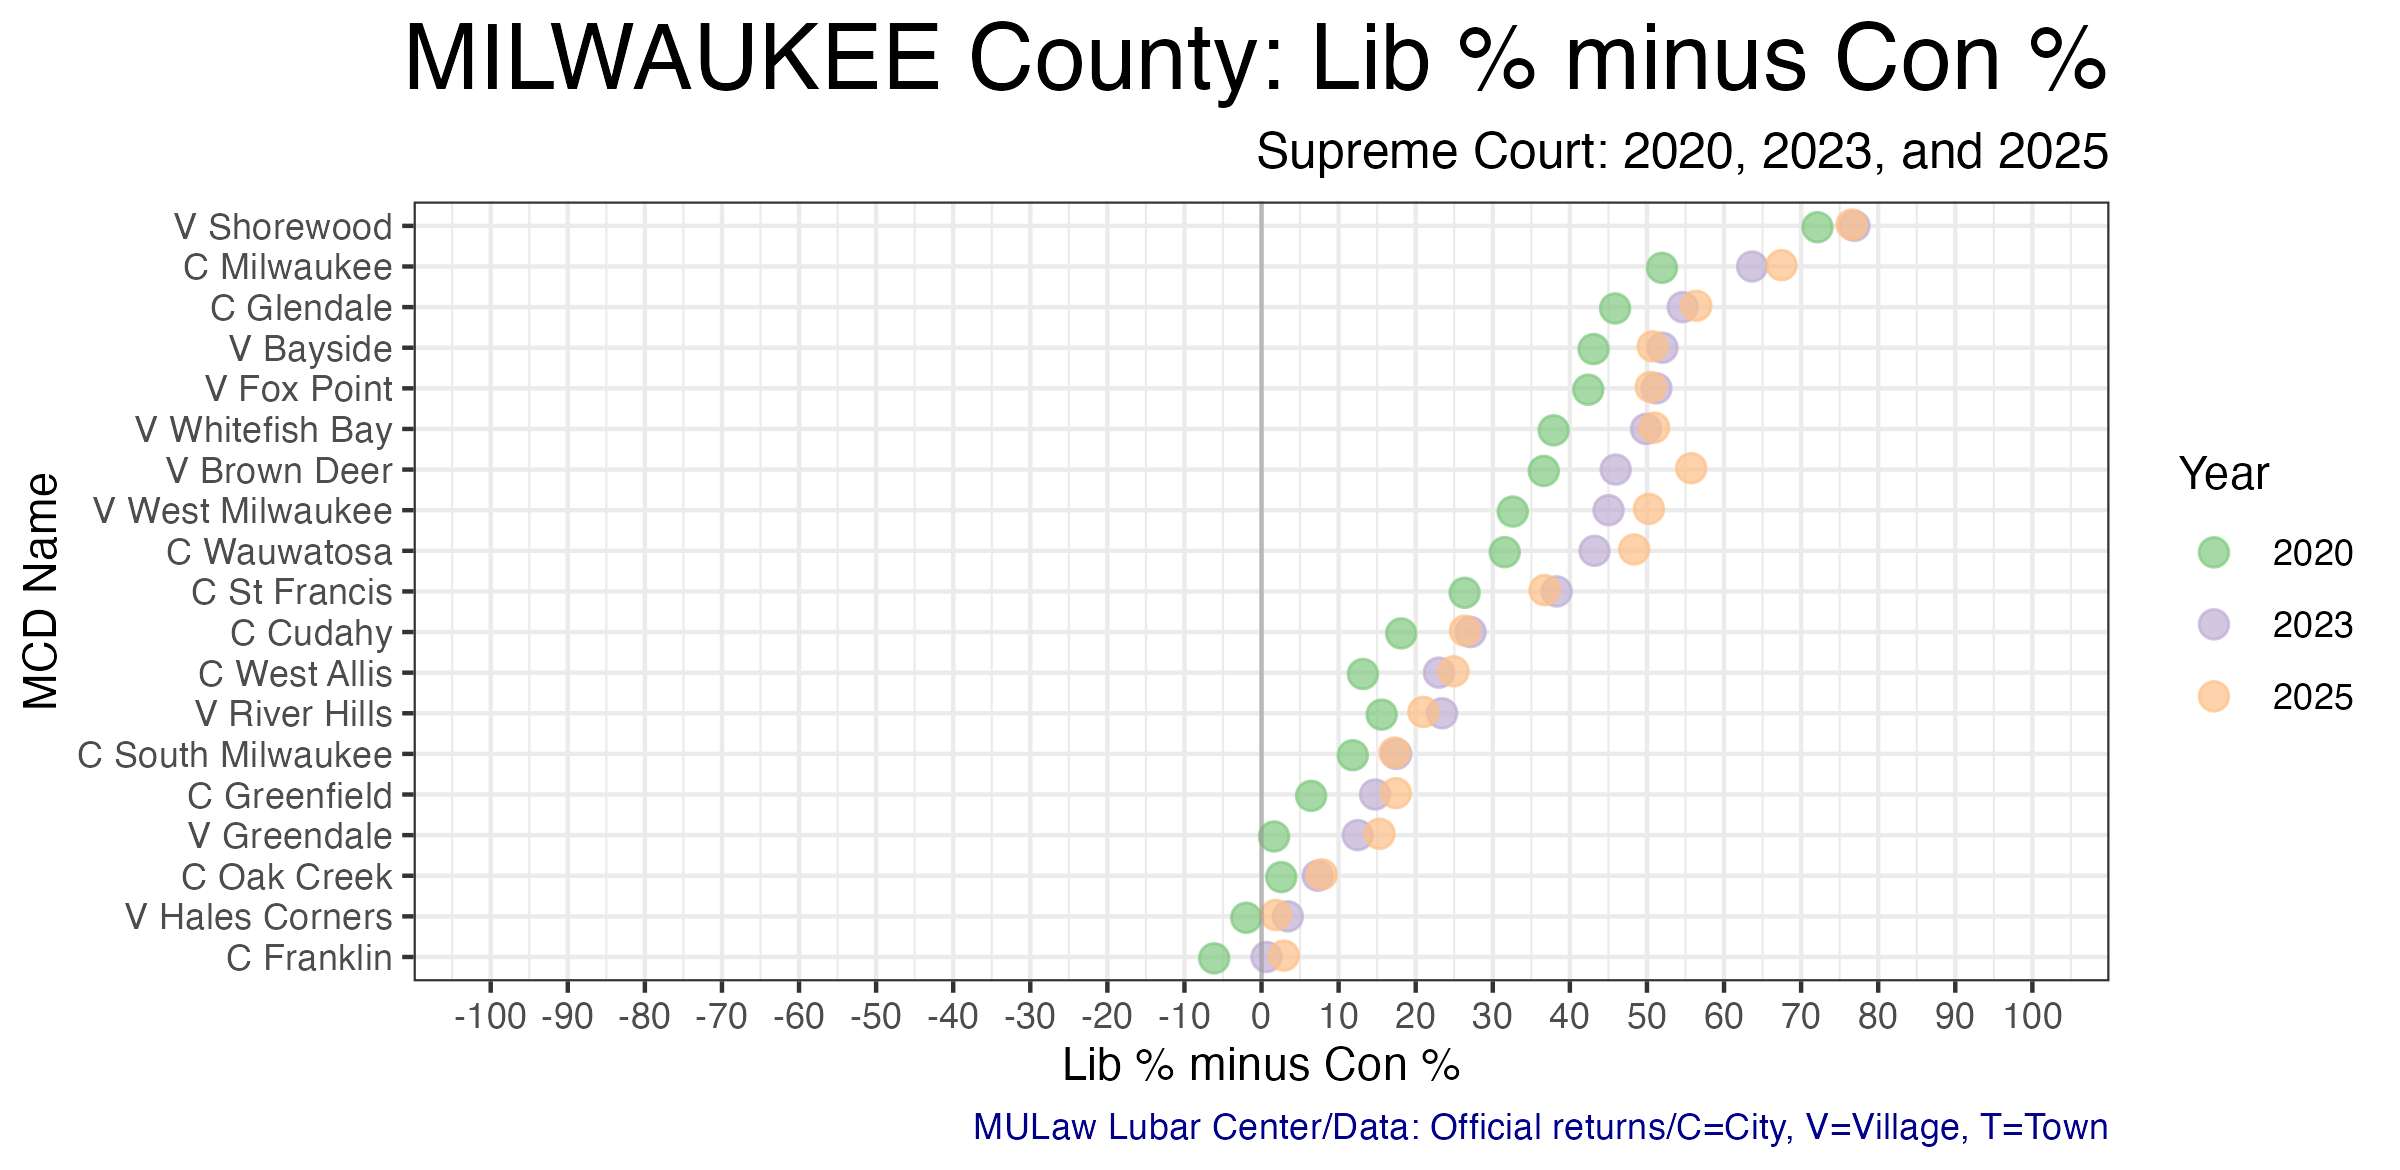
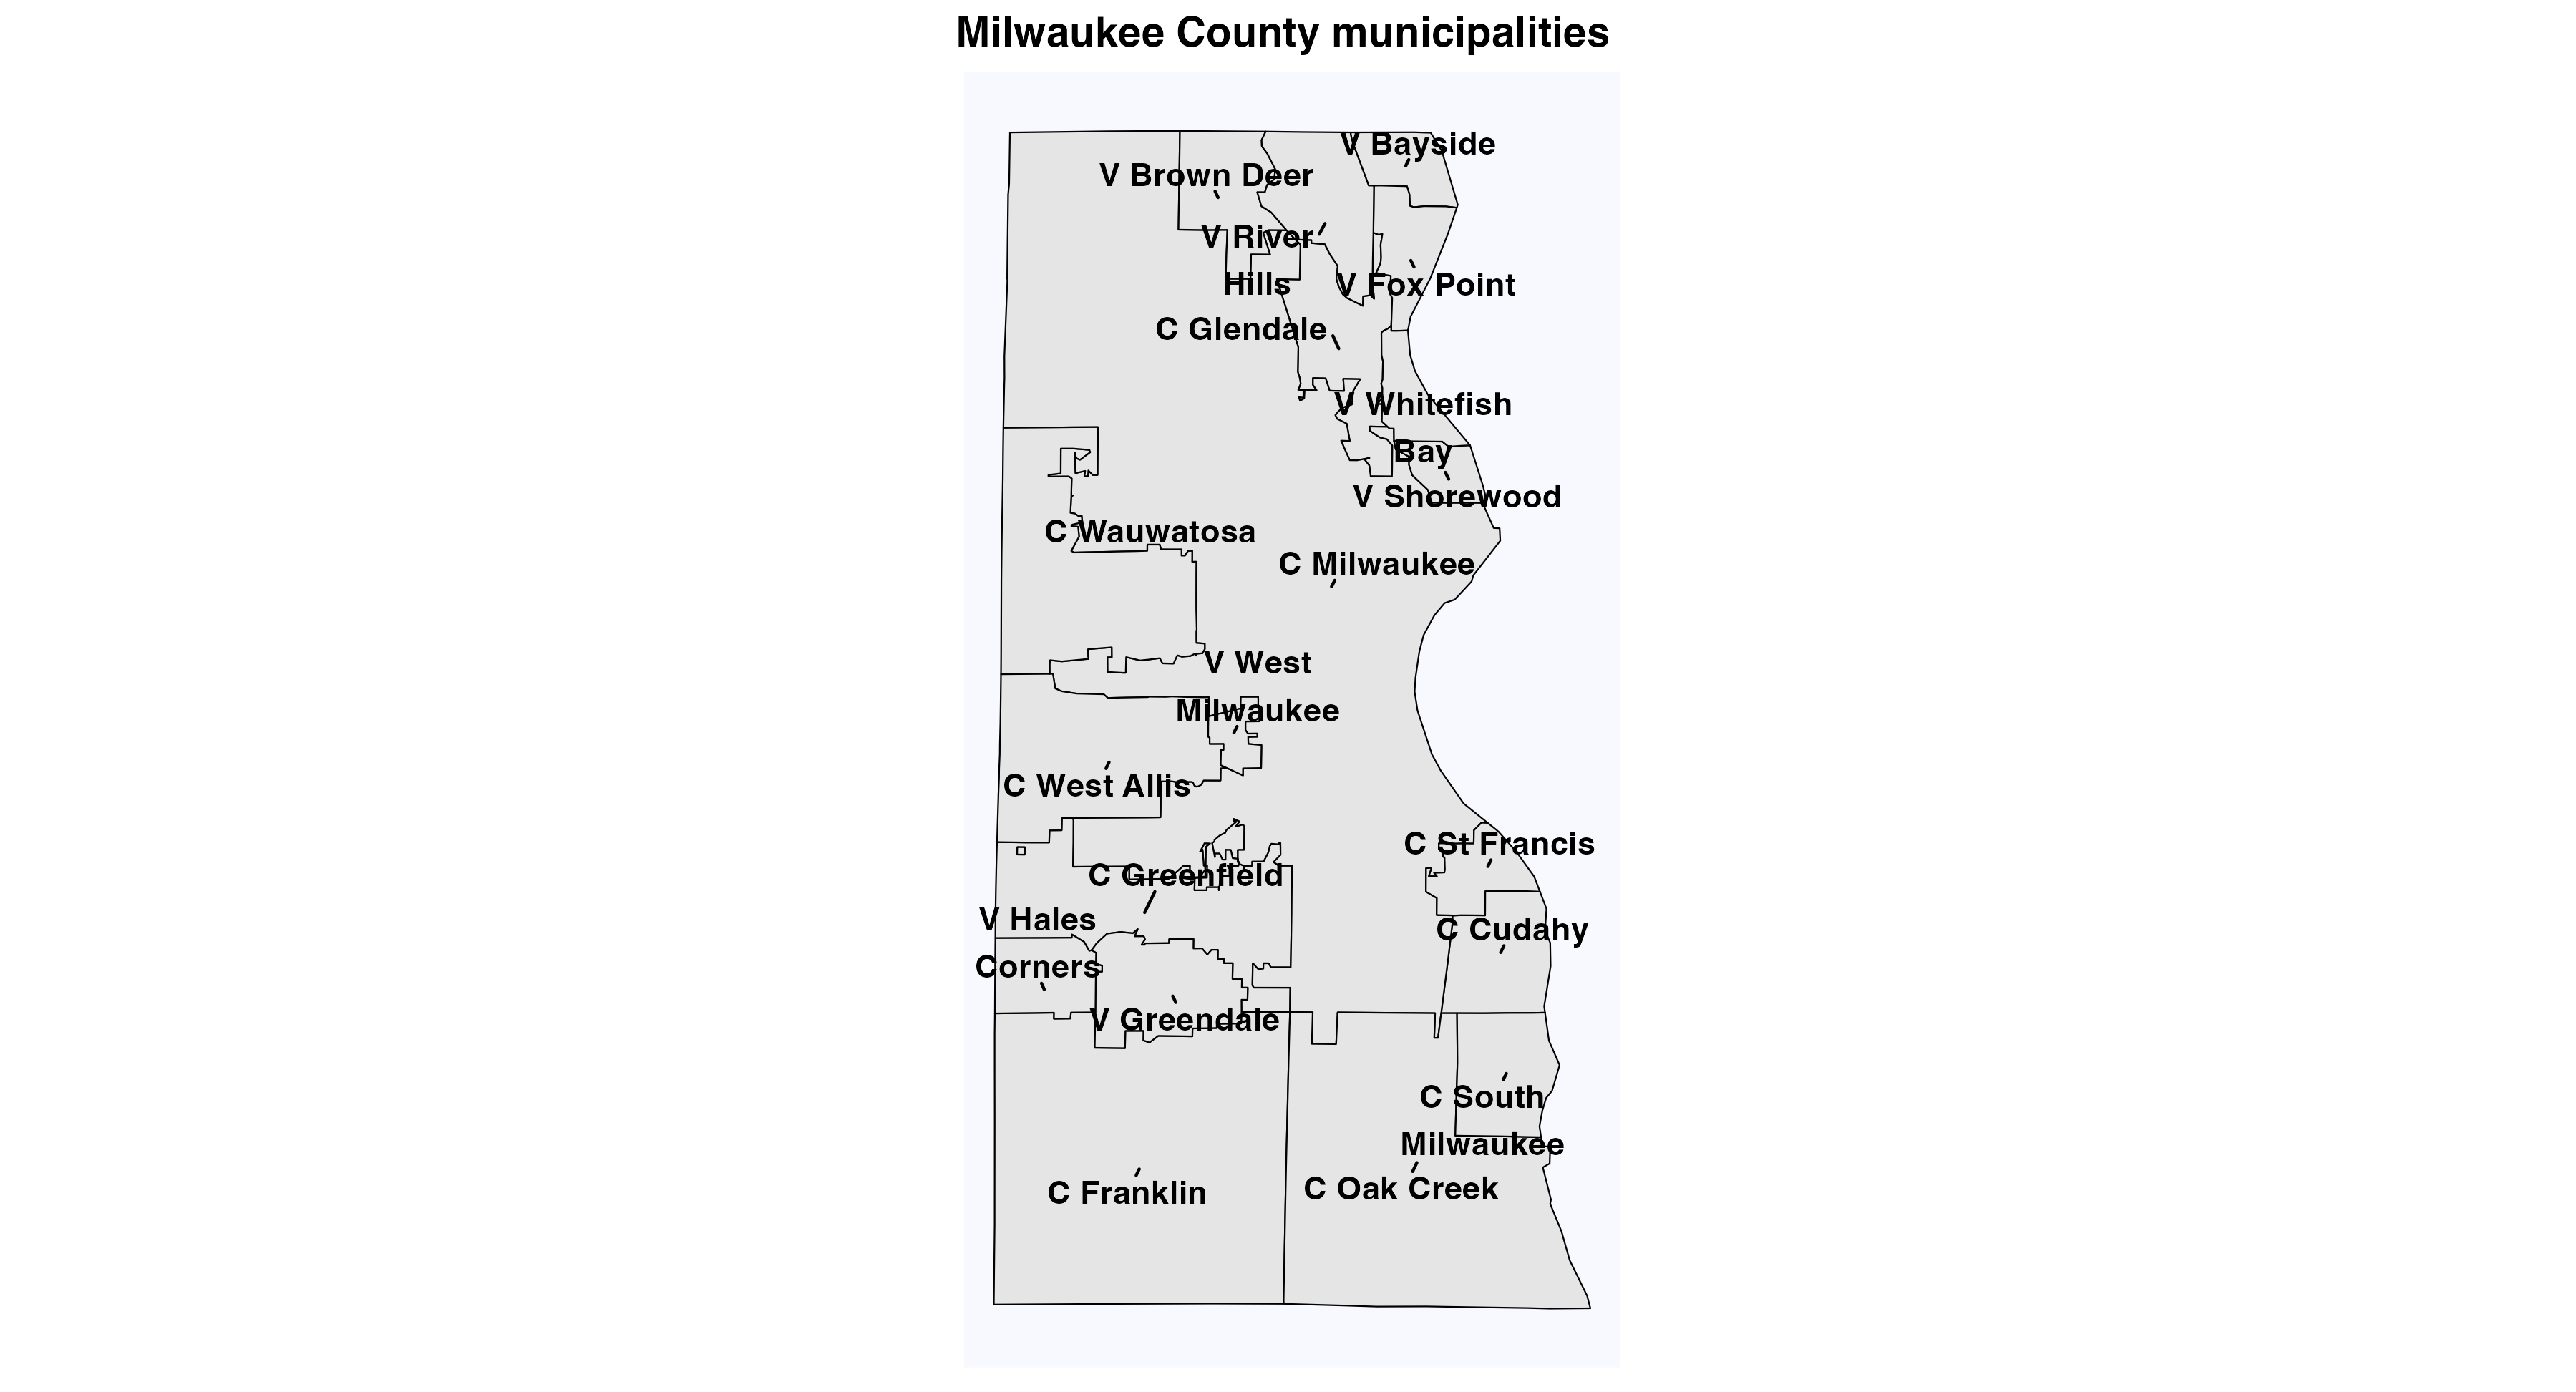
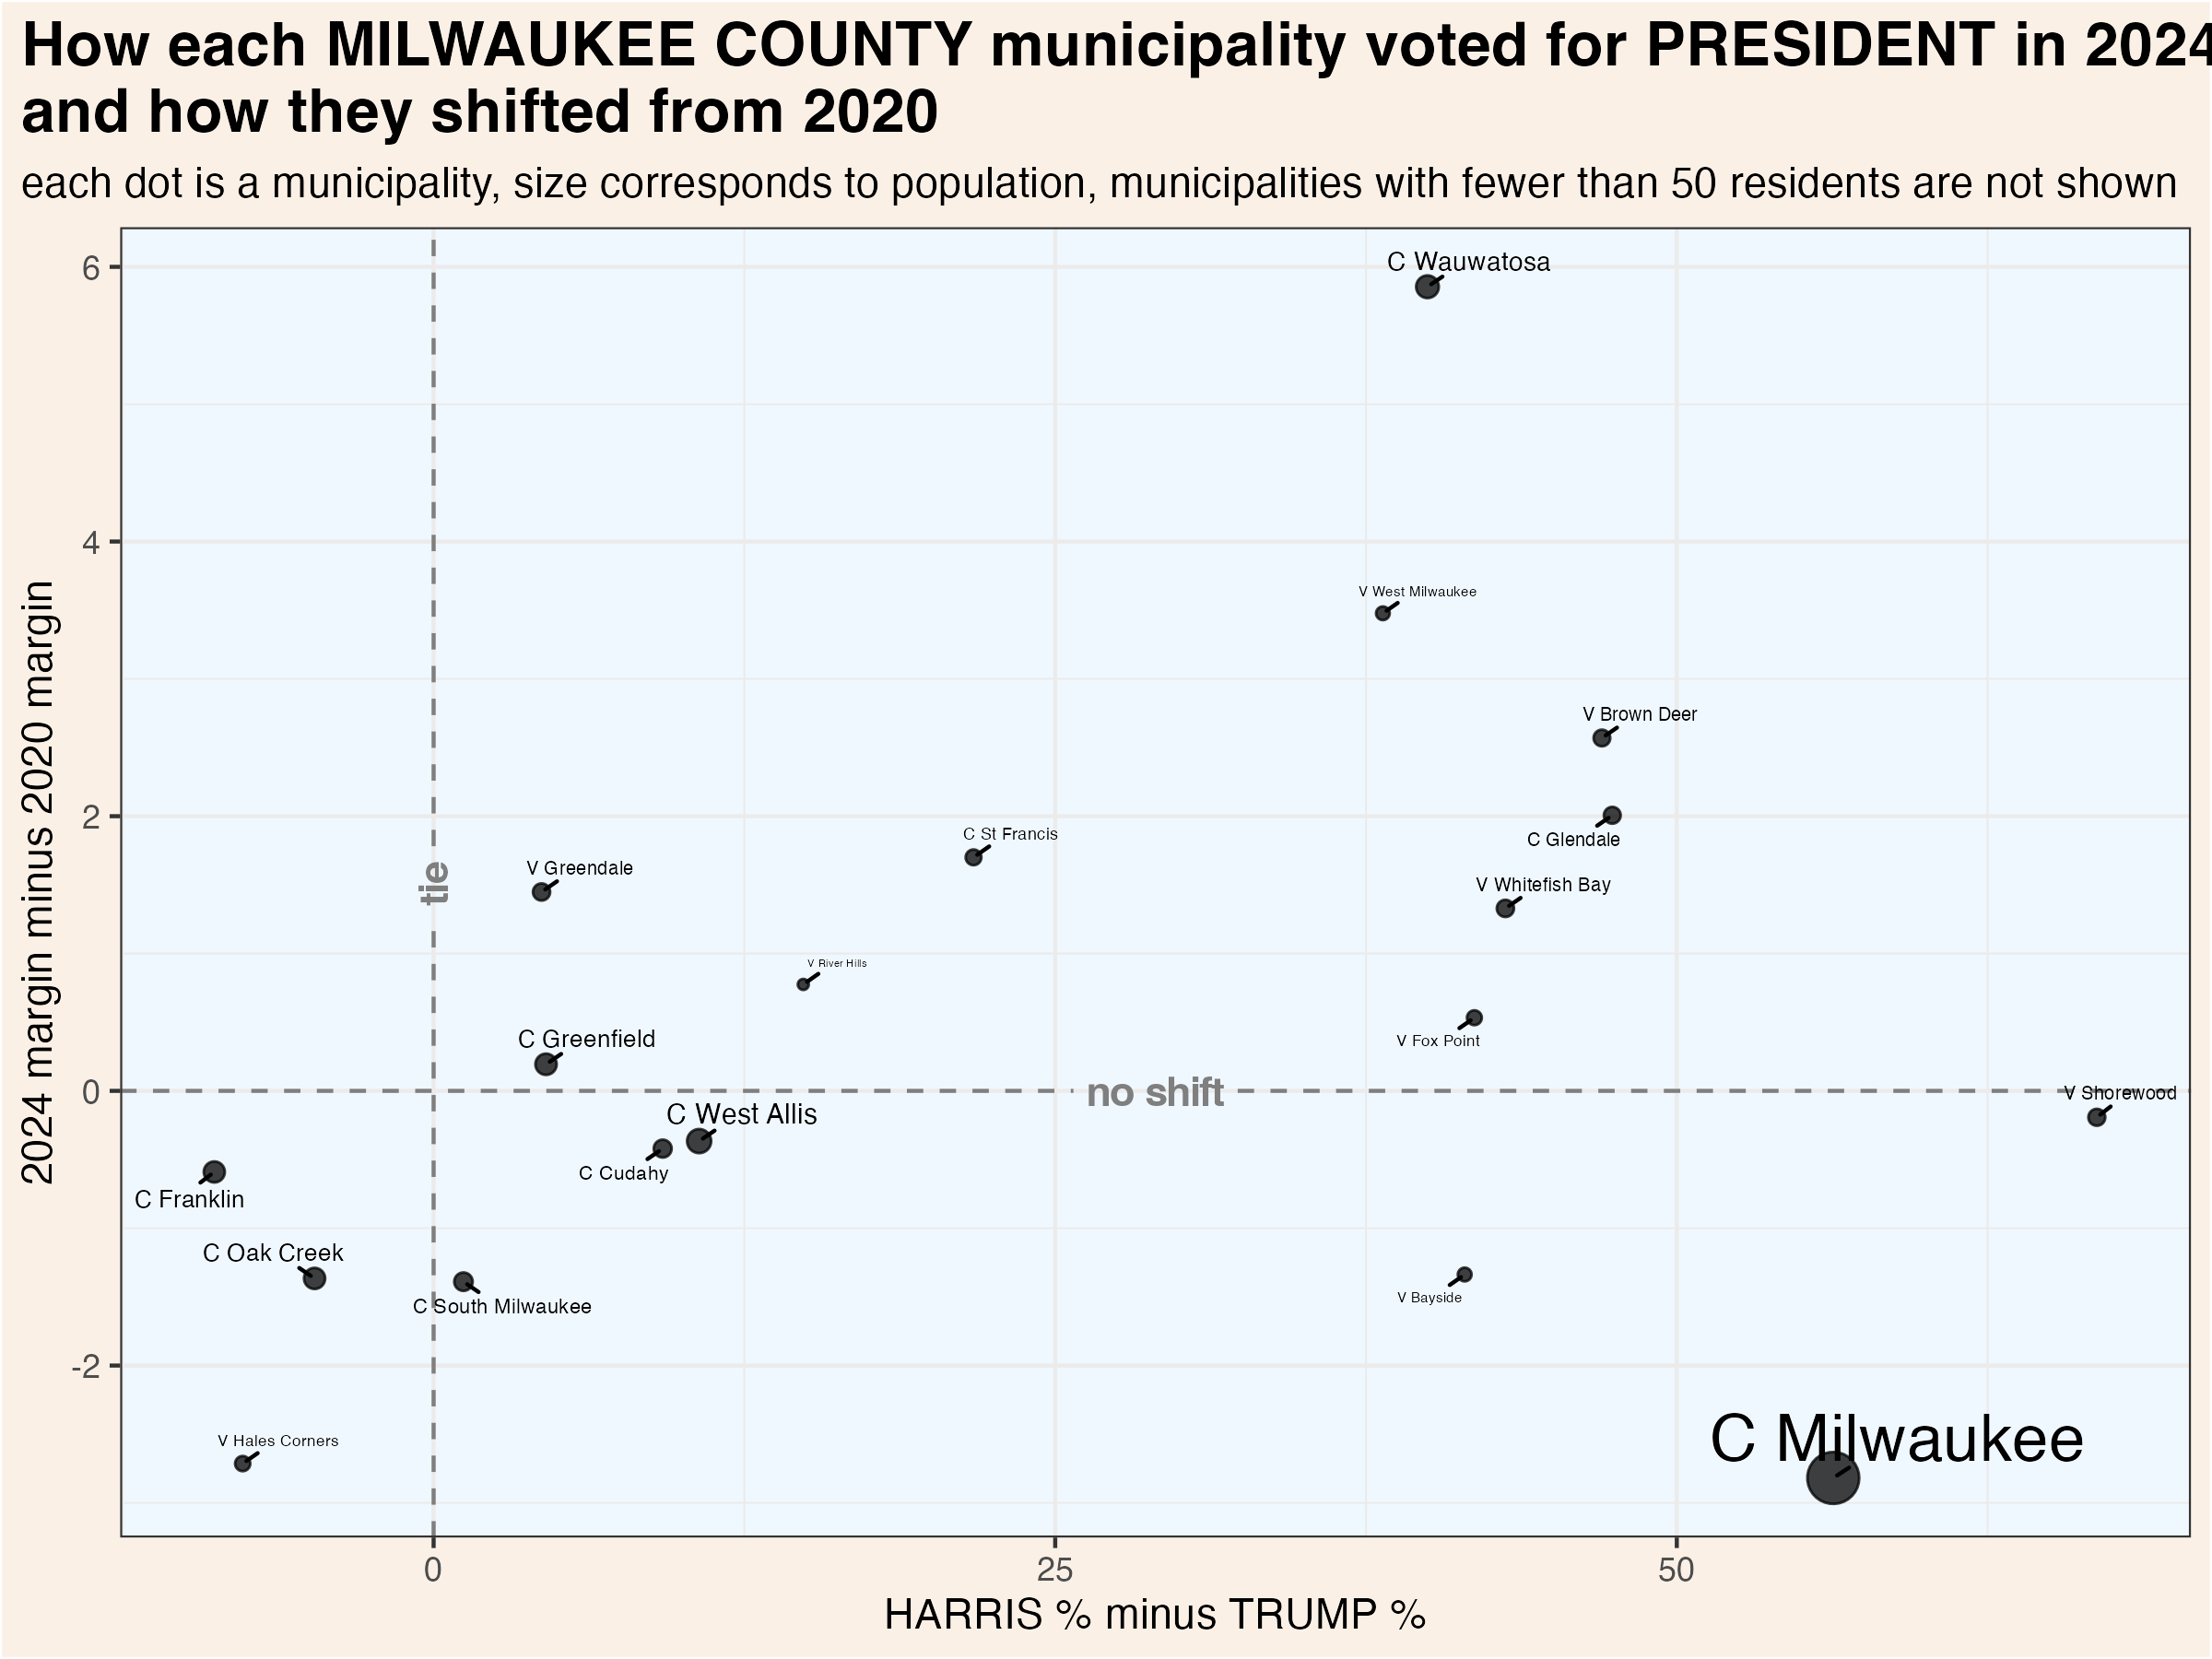
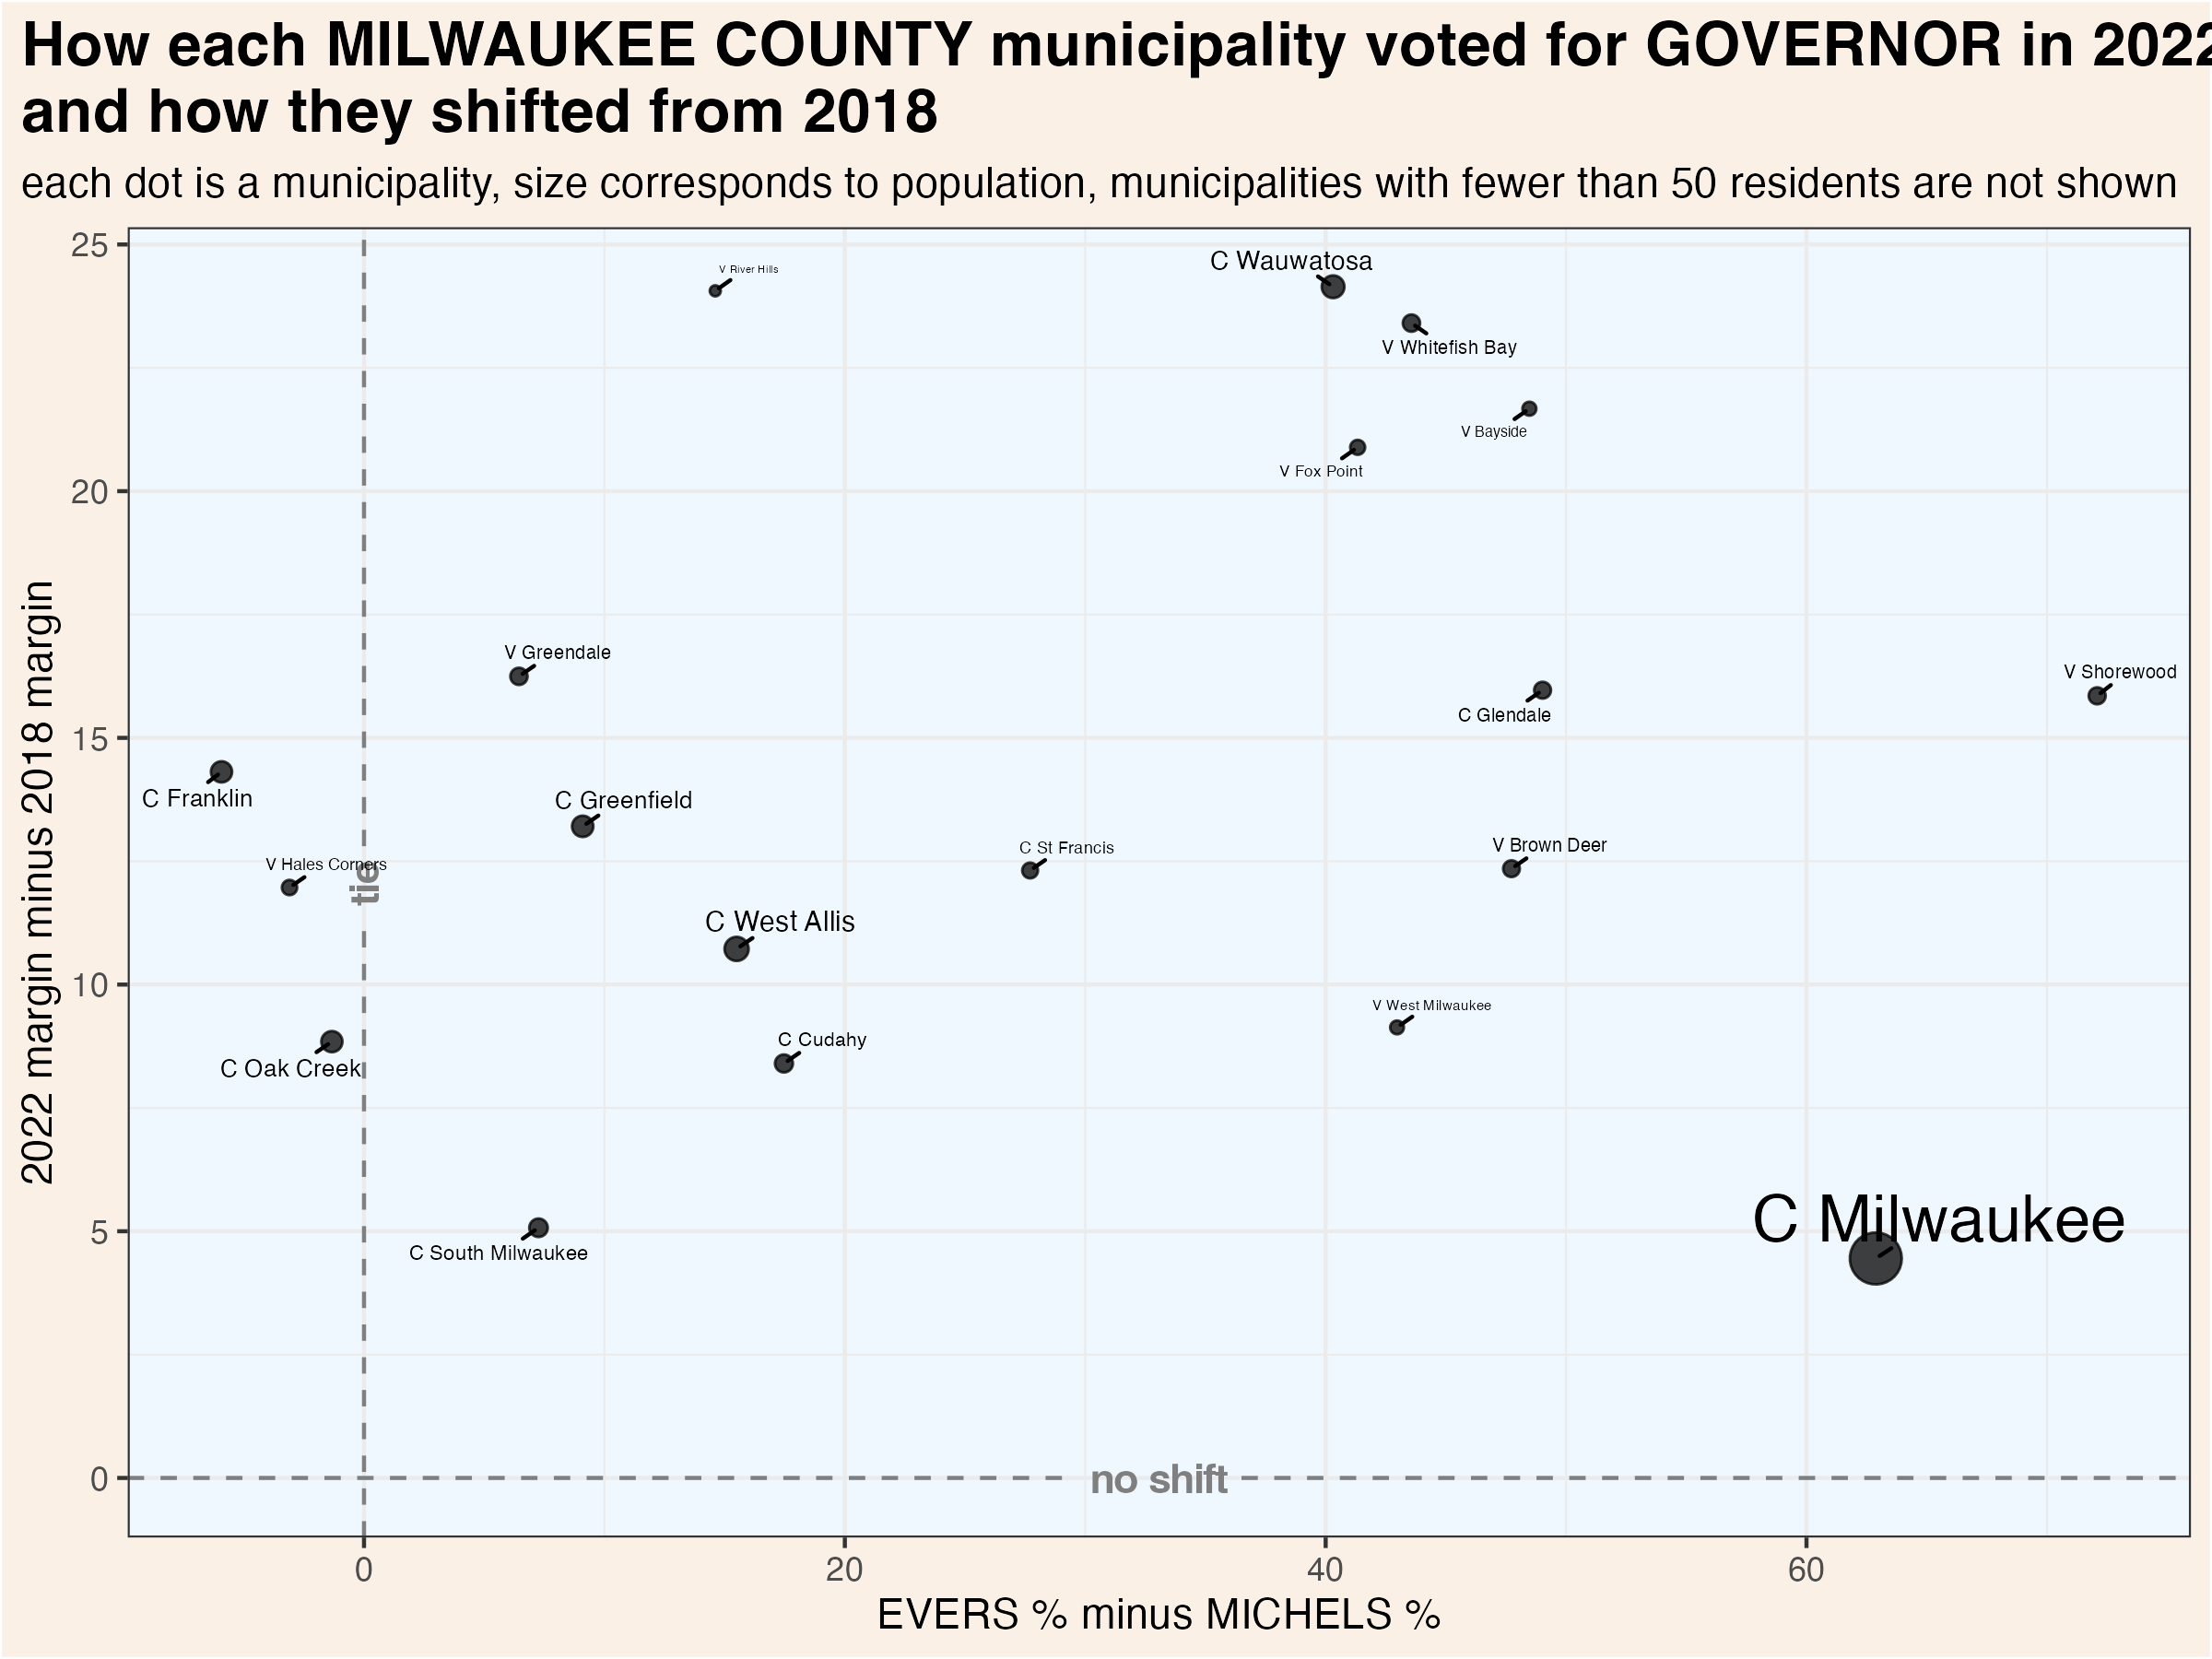
About 61% of the county’s population lives in the City of Milwaukee. The largest suburbs are West Allis and Wauwatosa. Generally speaking, the “north shore” suburbs are wealthier and have (with the exception of Brown Deer and Glendale) large white majorities. These suburbs have shifted very strongly toward the Democratic party since the emergence of Donald Trump on the political scene. In fact, the City of Milwaukee, which has seen little overall political change over the last several cycles, is no longer the most Democratic-leaning community in the county. That distinction now belongs to the Village of Shorewood. Milwaukee County’s southern and southwestern suburbs tend to be more conservative. But even these historically Republican-leaning municipalities have shifted toward the Democrats in recent cycles–even as much of the rest of the state has moved in a Republican direction.
This map shows the location of each municipality in the county, as it existed in 2022.
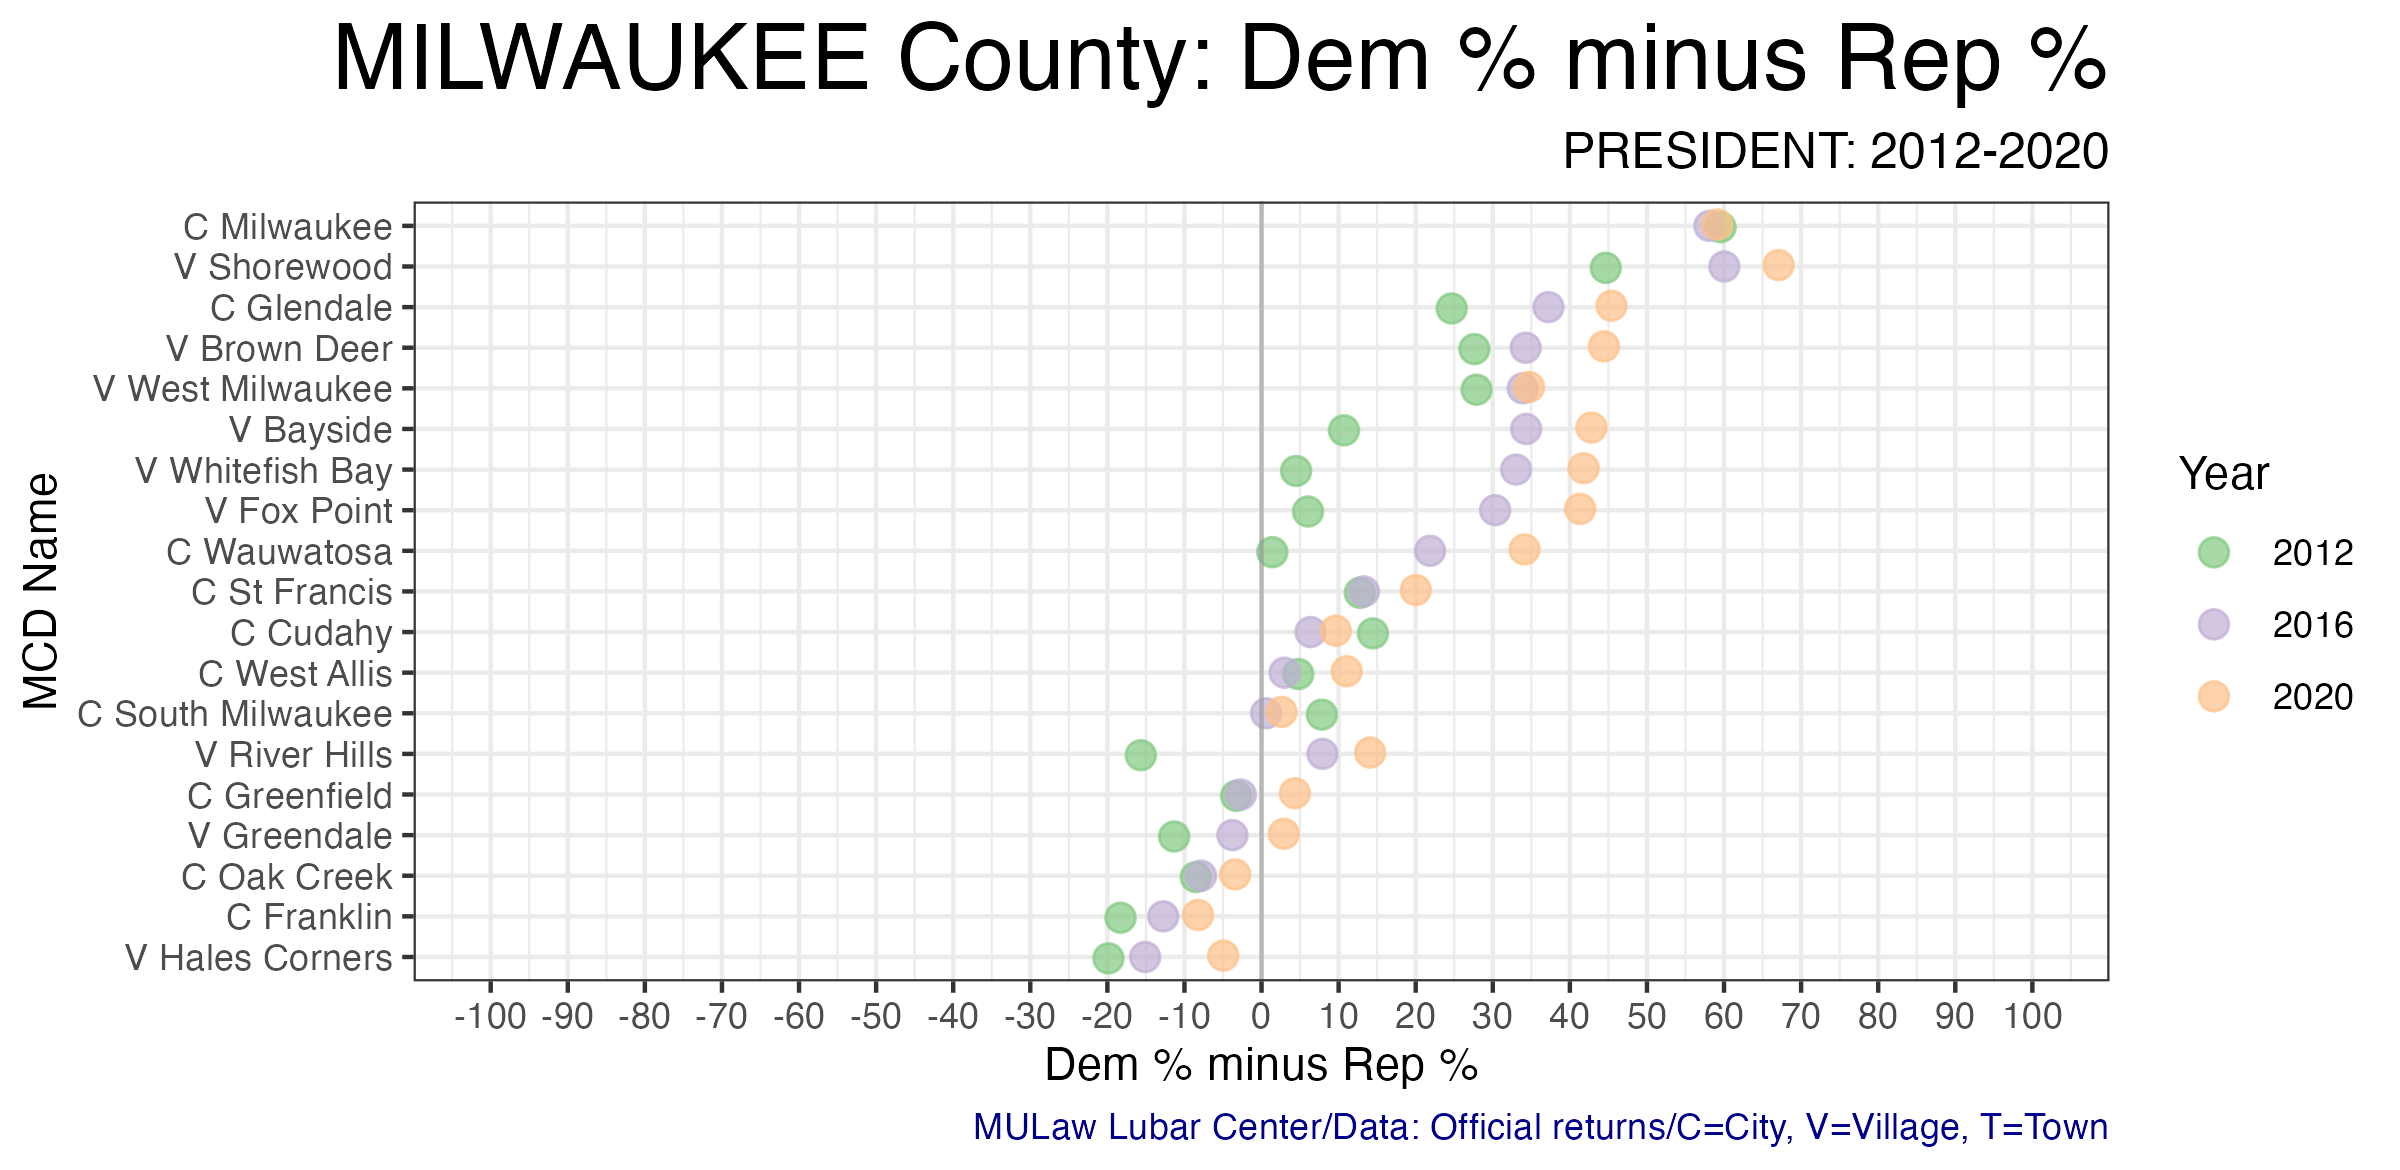
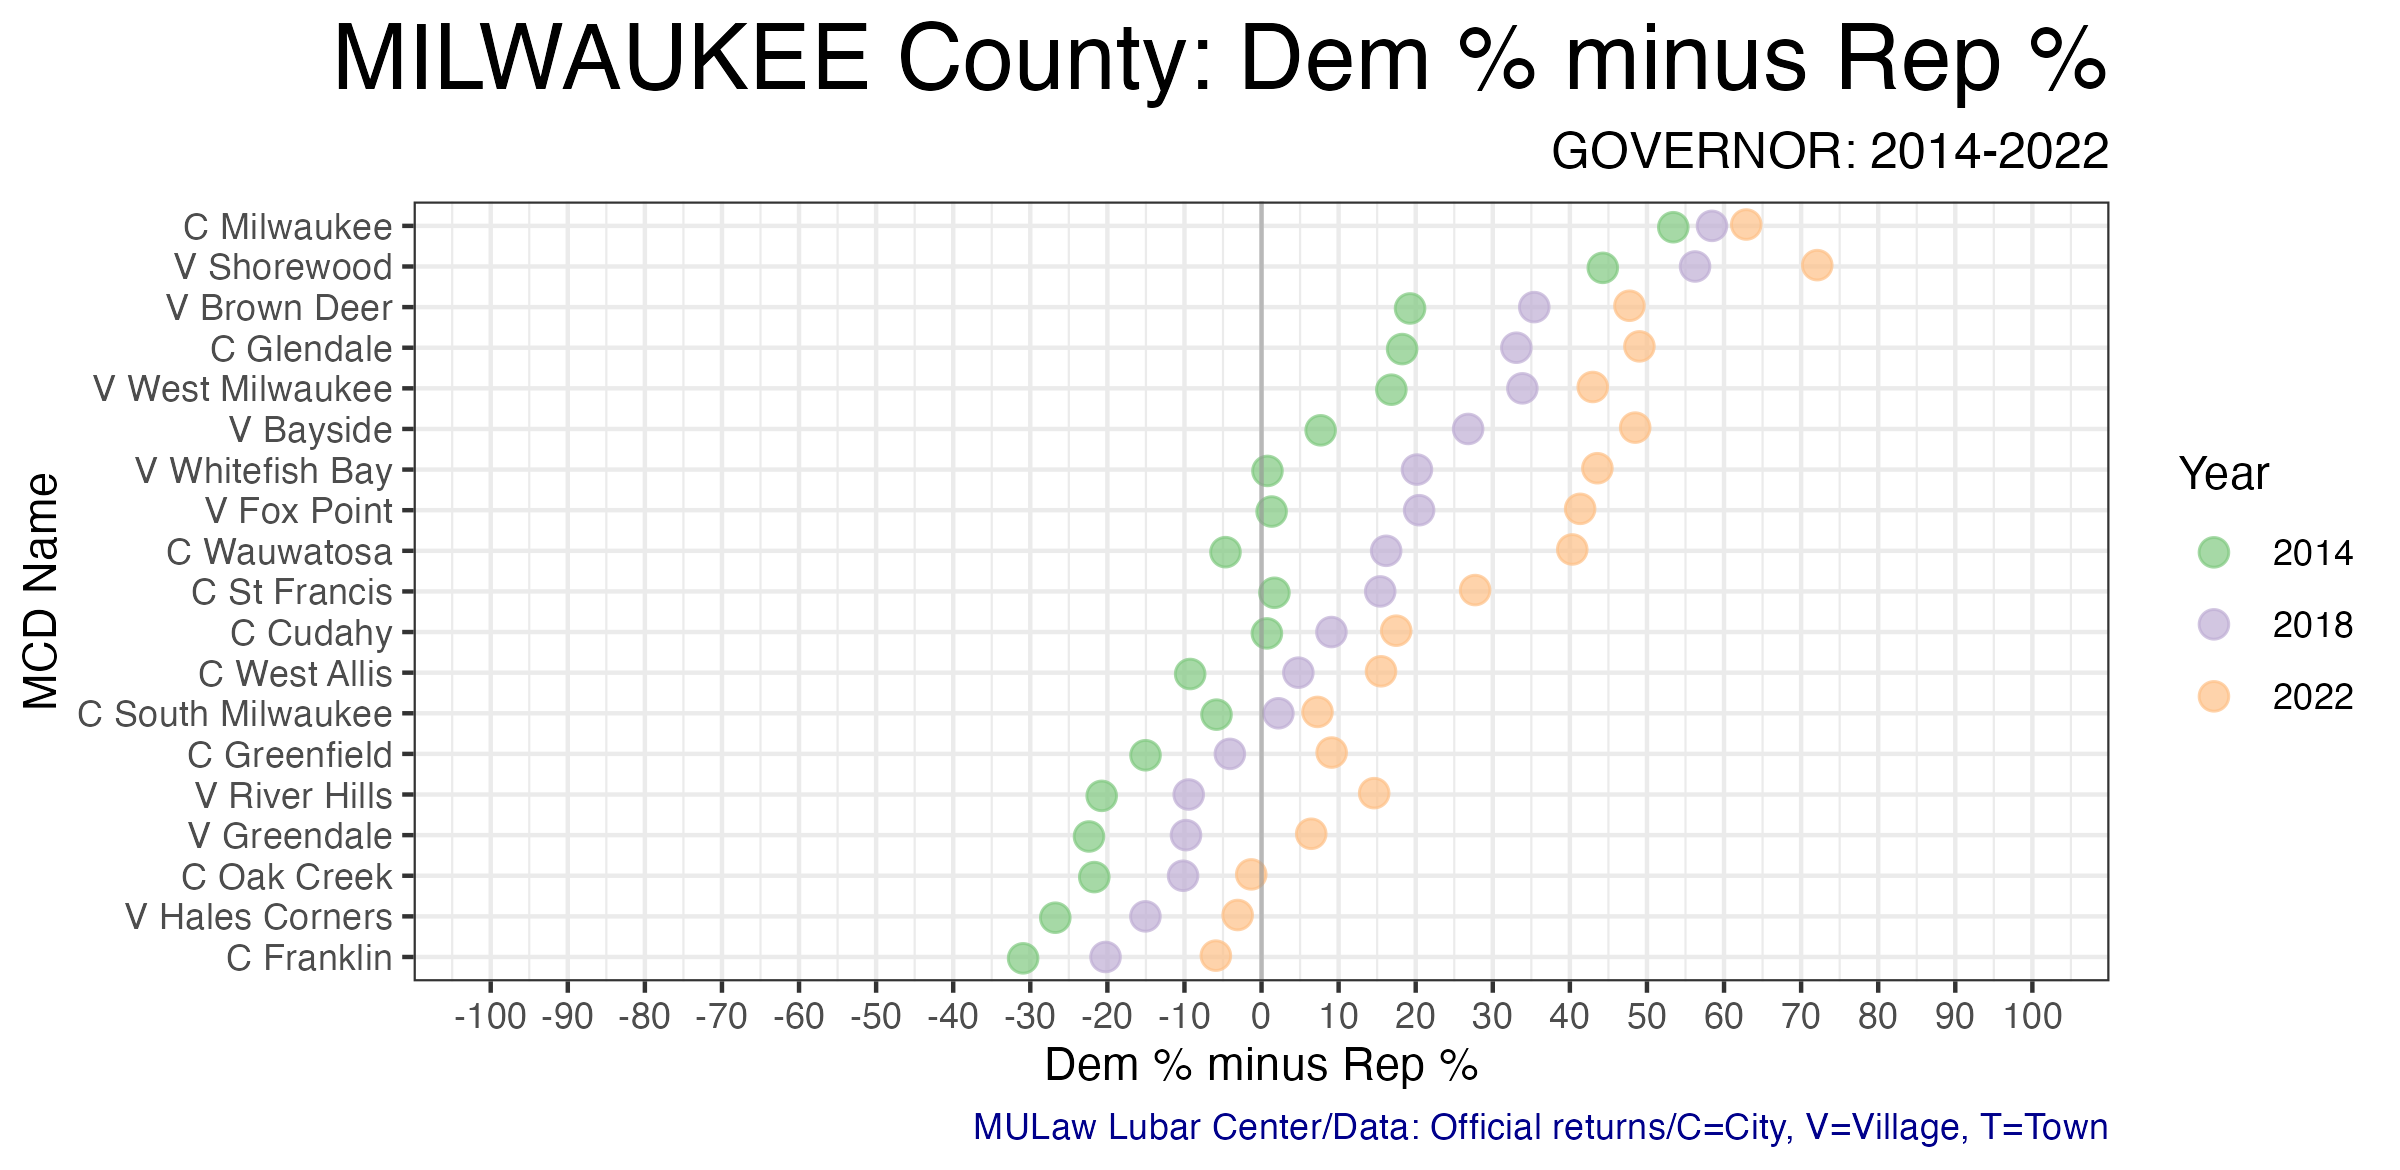
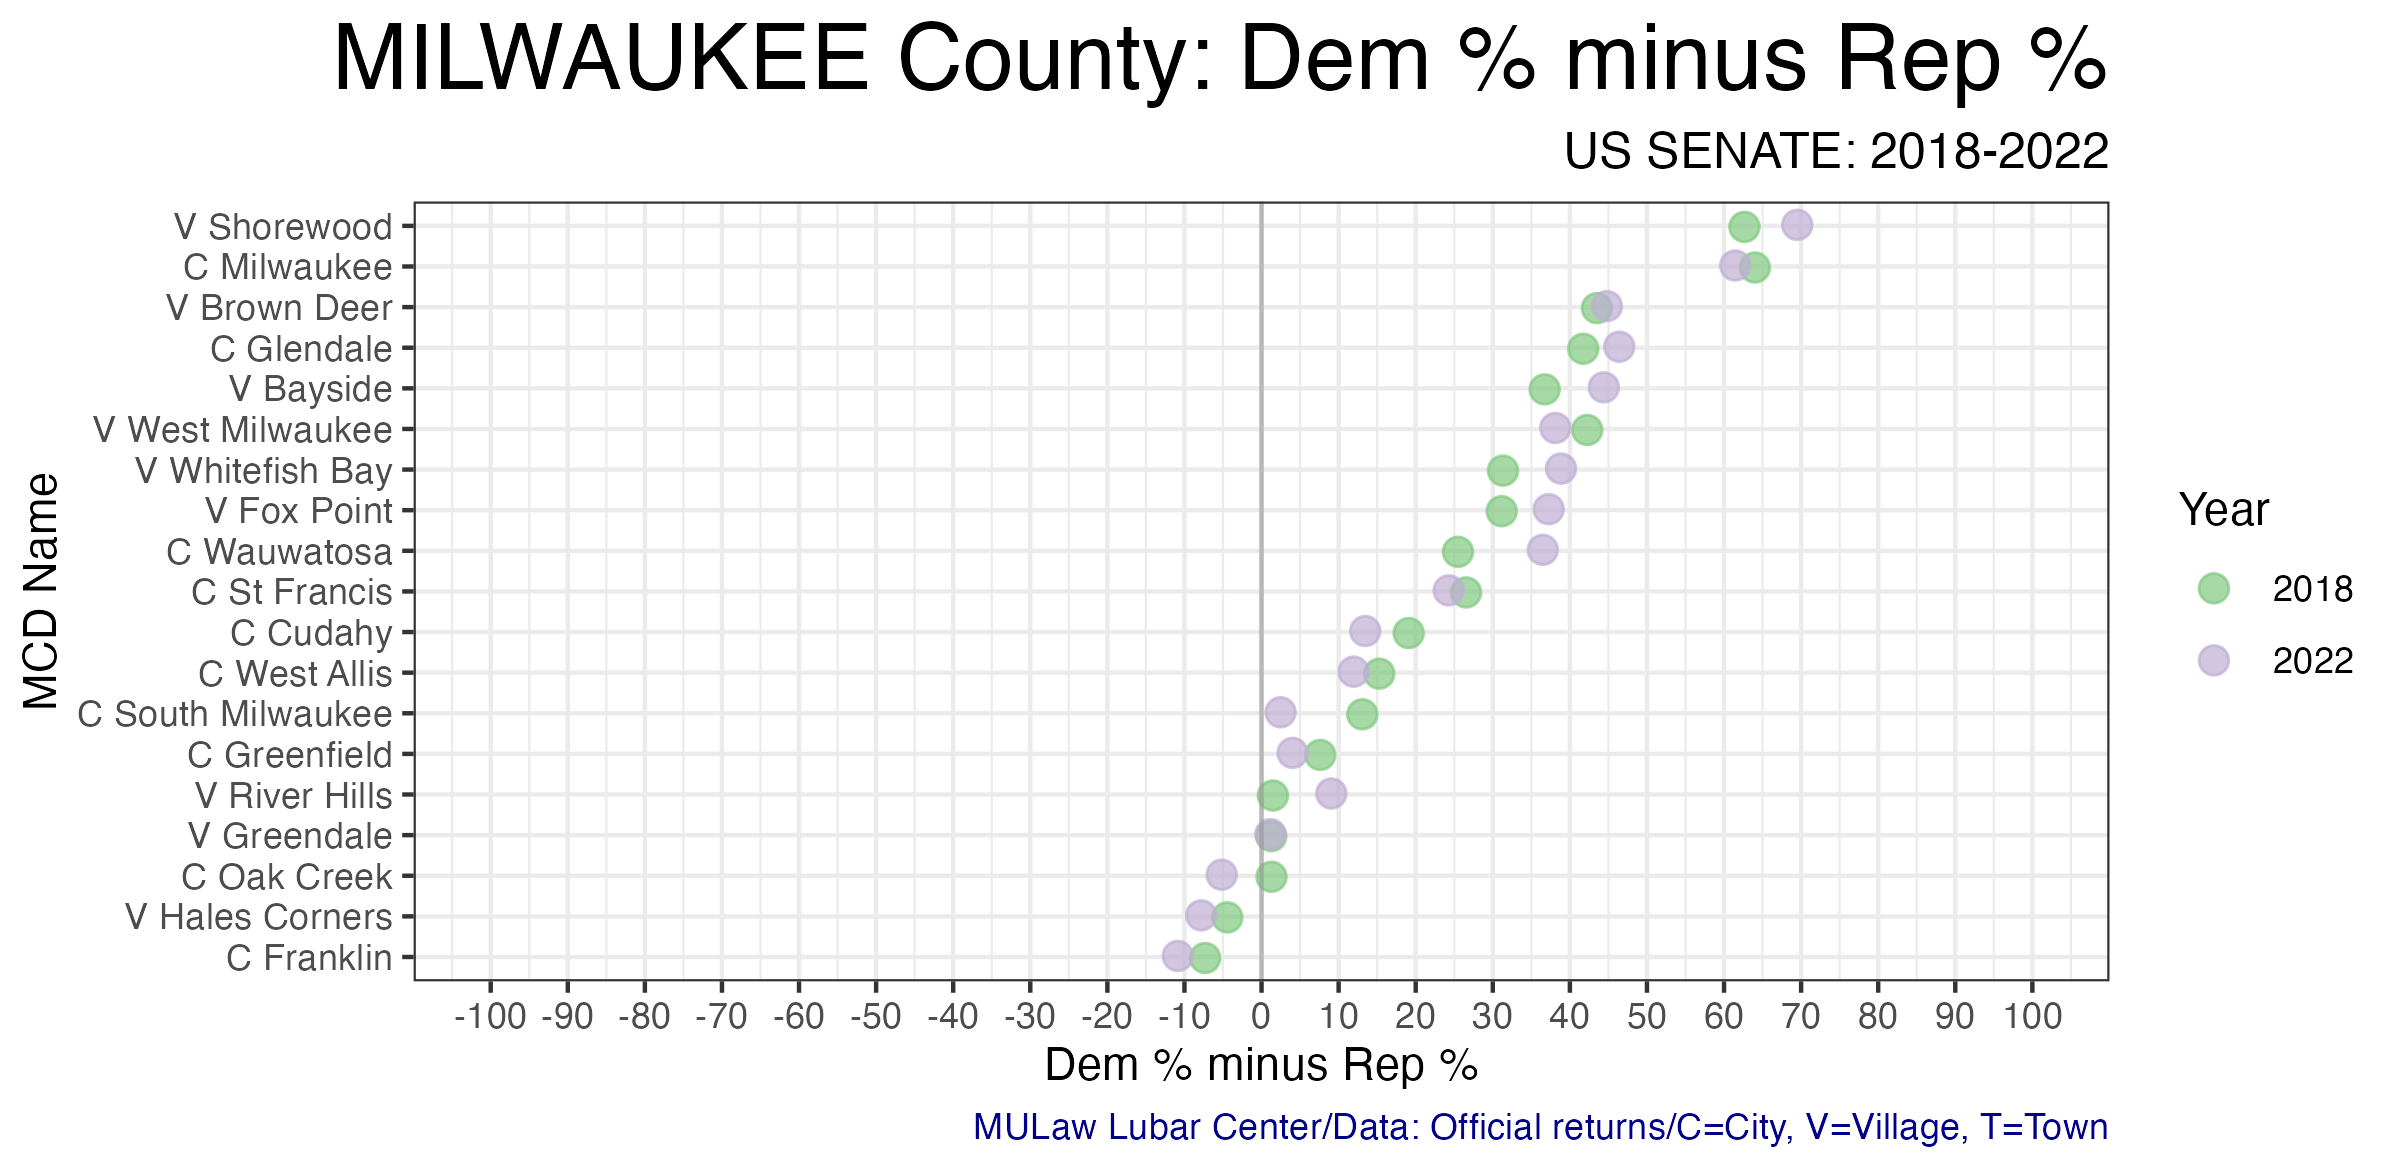
These dot plots show the most recent election results in each municipality.
To more clearly illustrate recent changes in municipality voting trends, these scatterplots compare the most recent vote for president and senator with the shift from that office’s previous election.
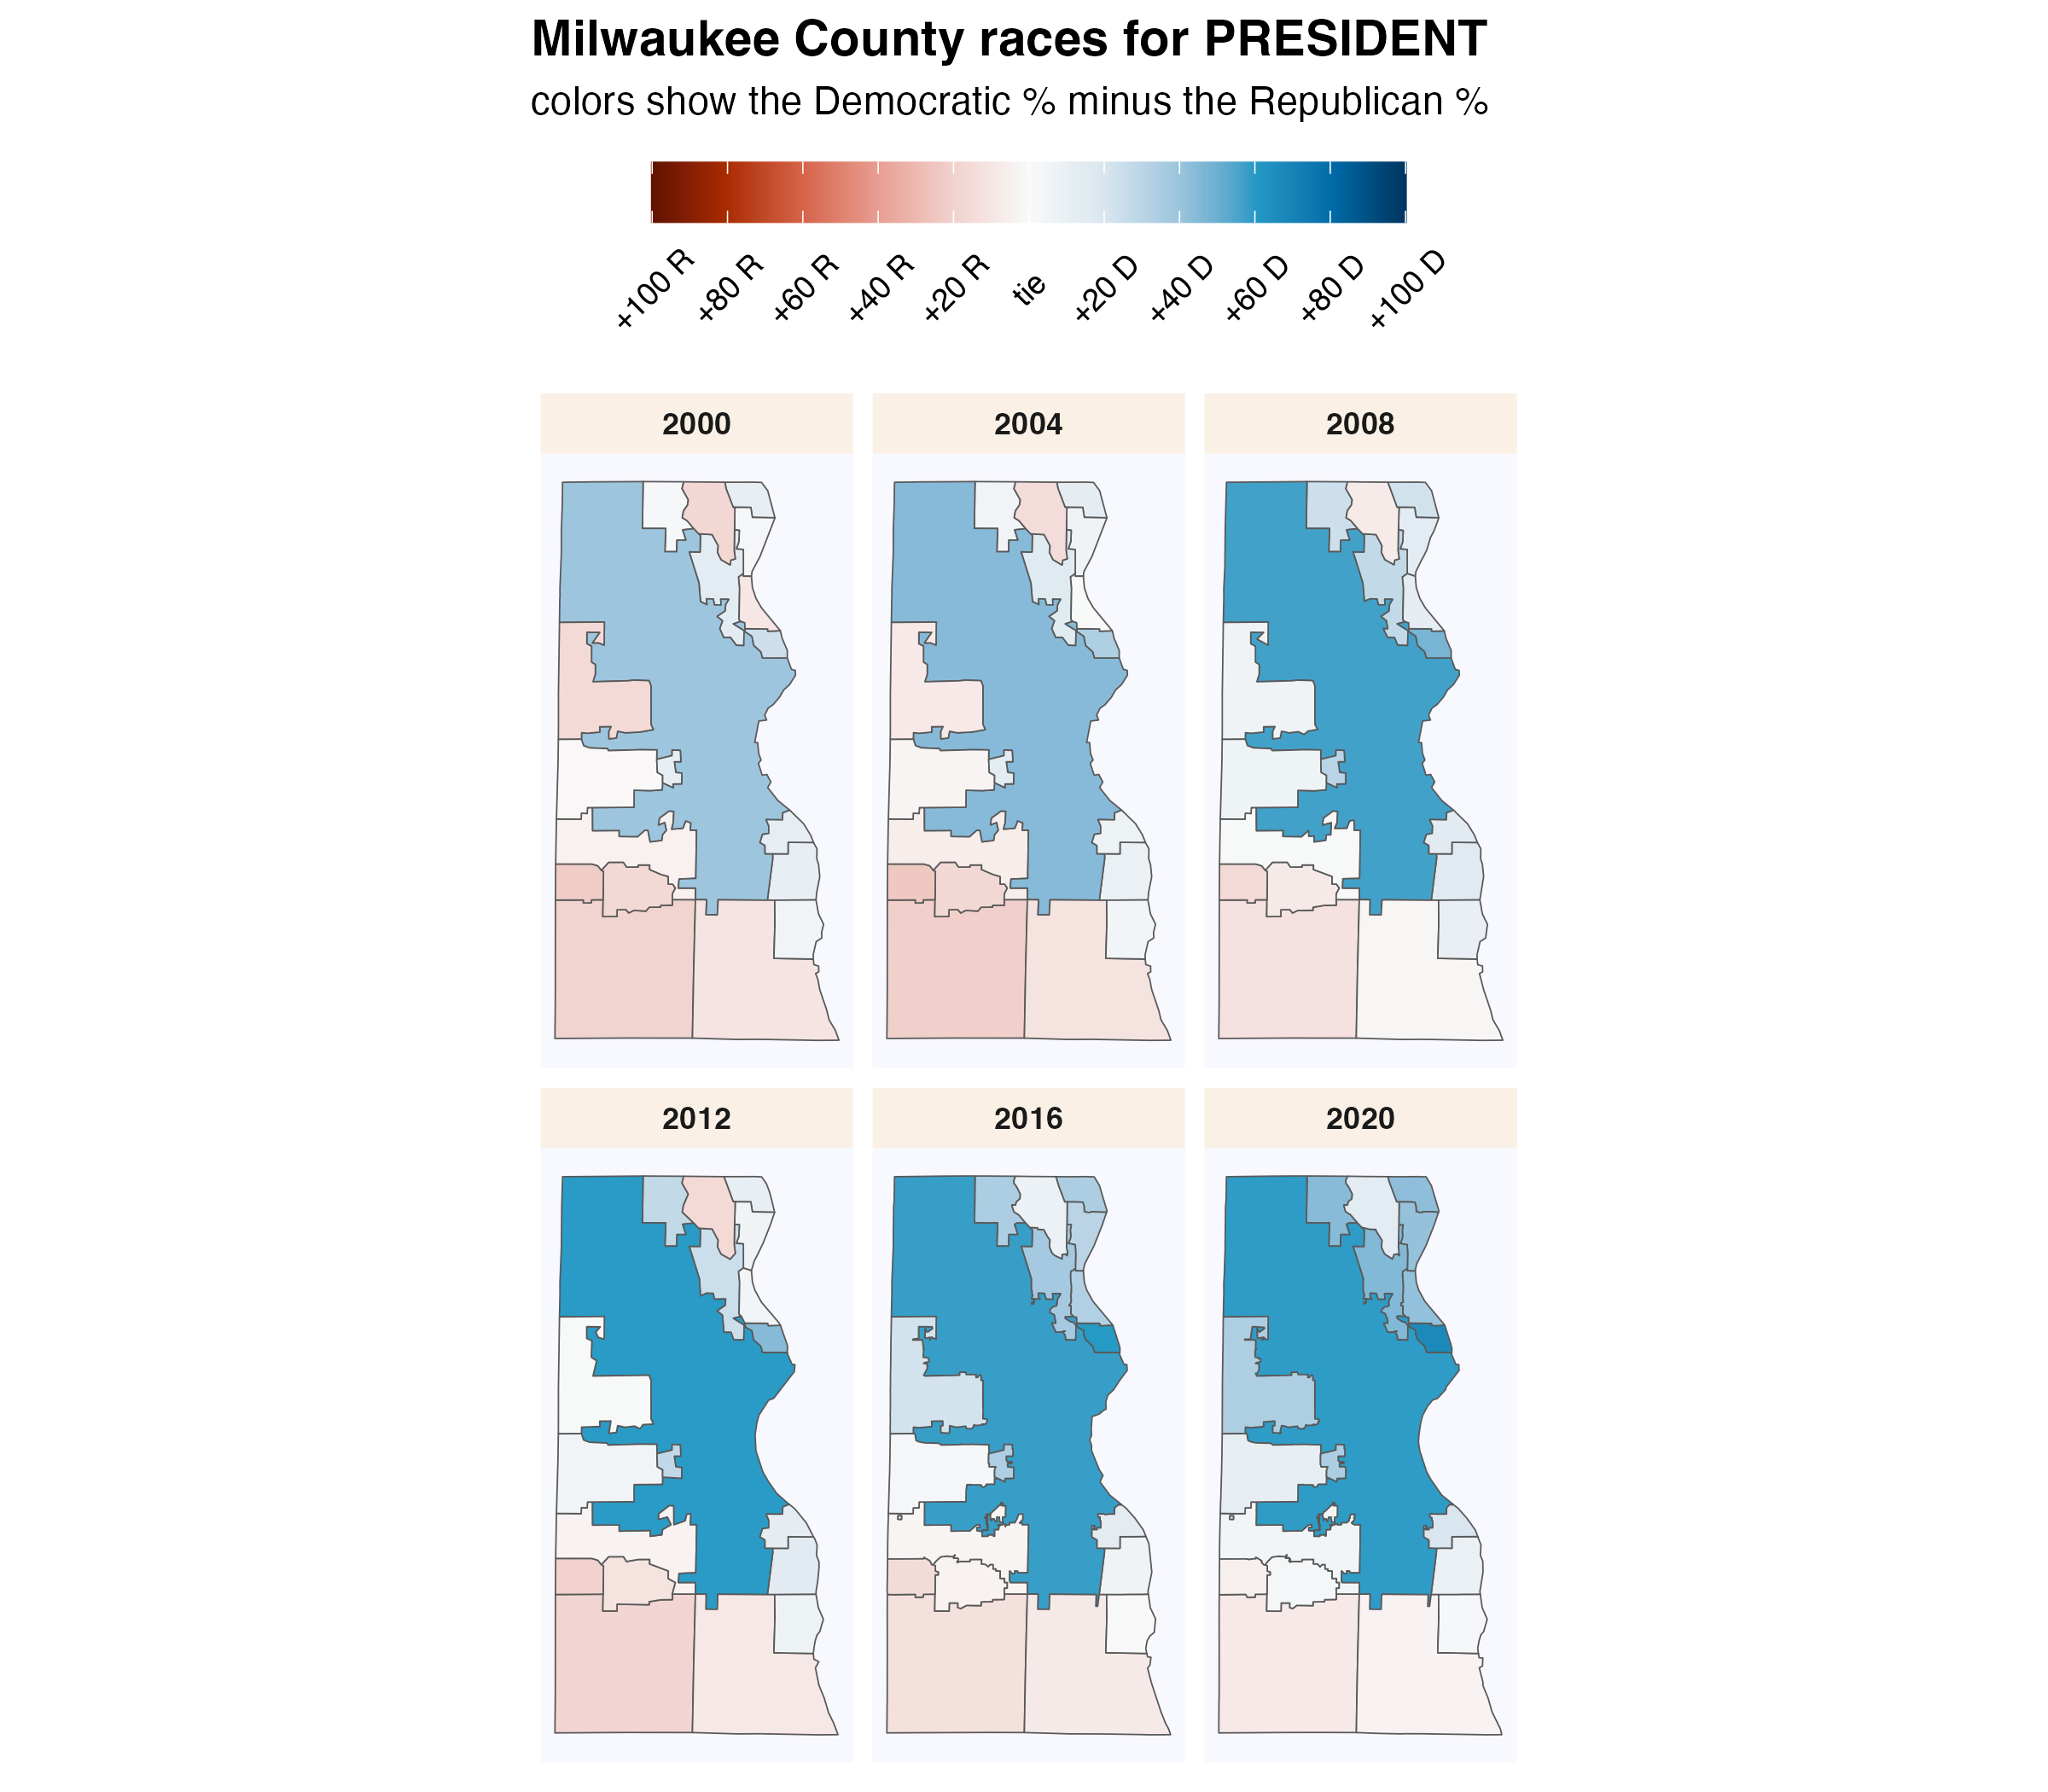
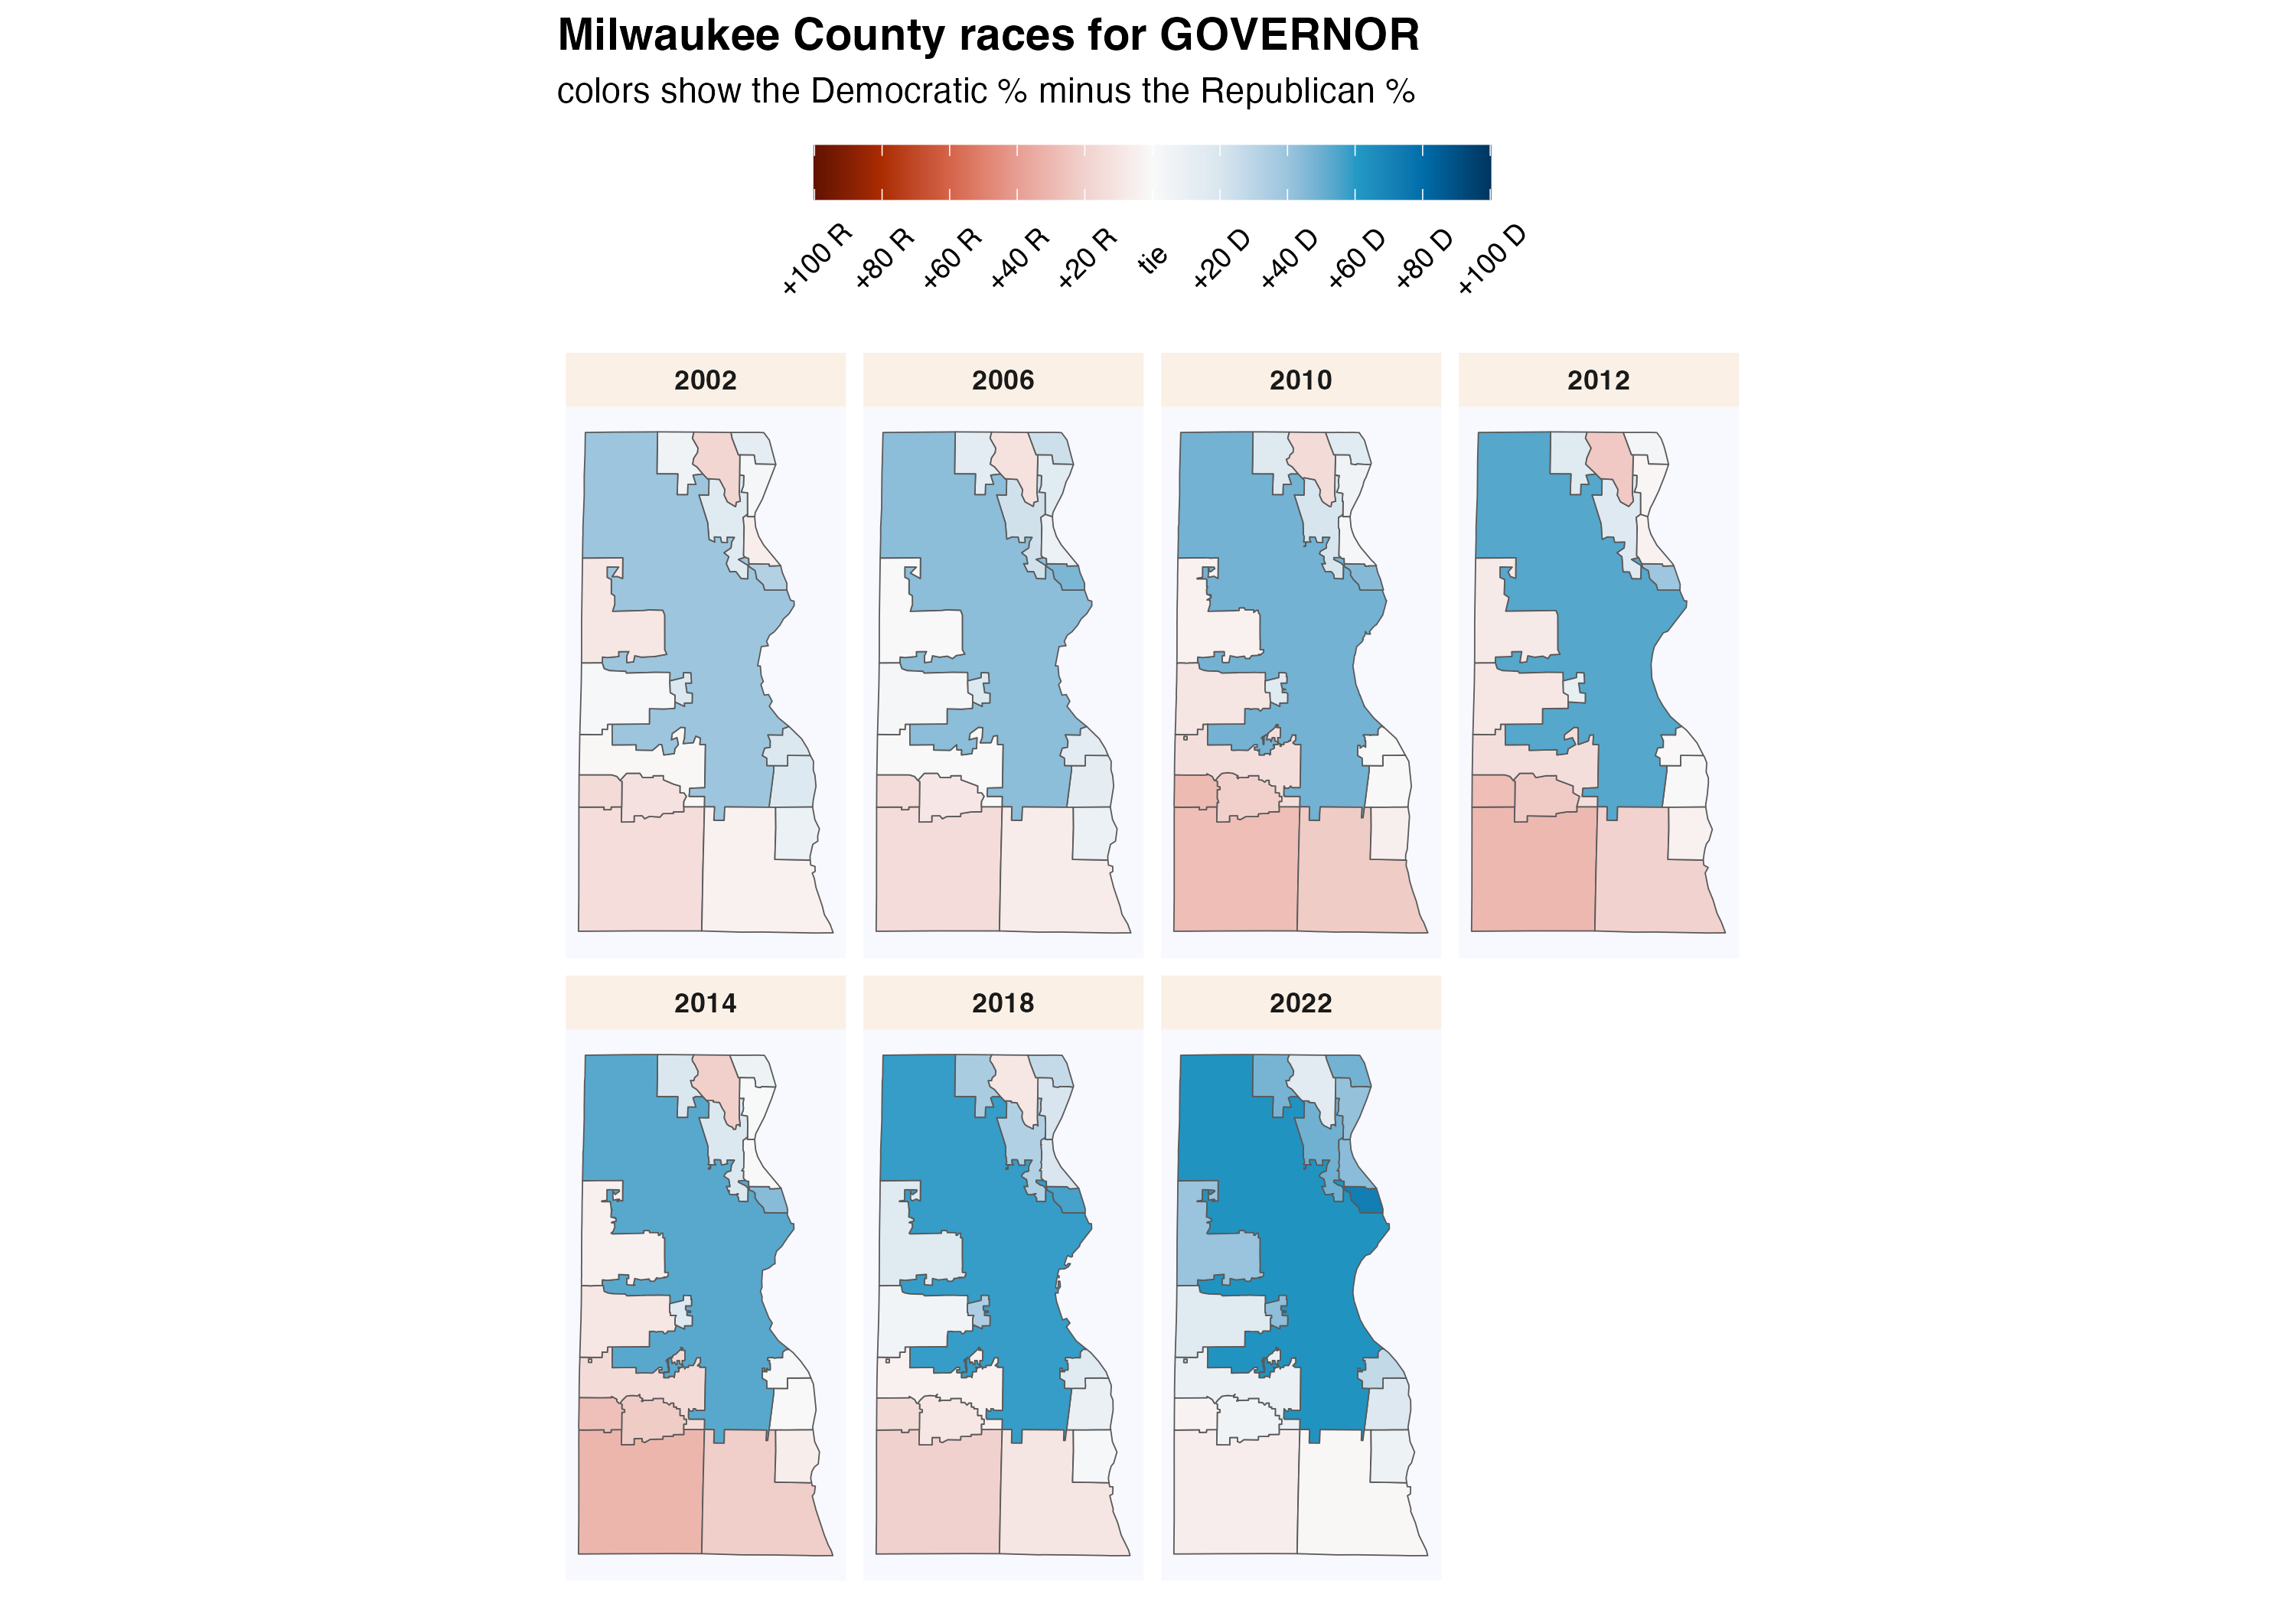
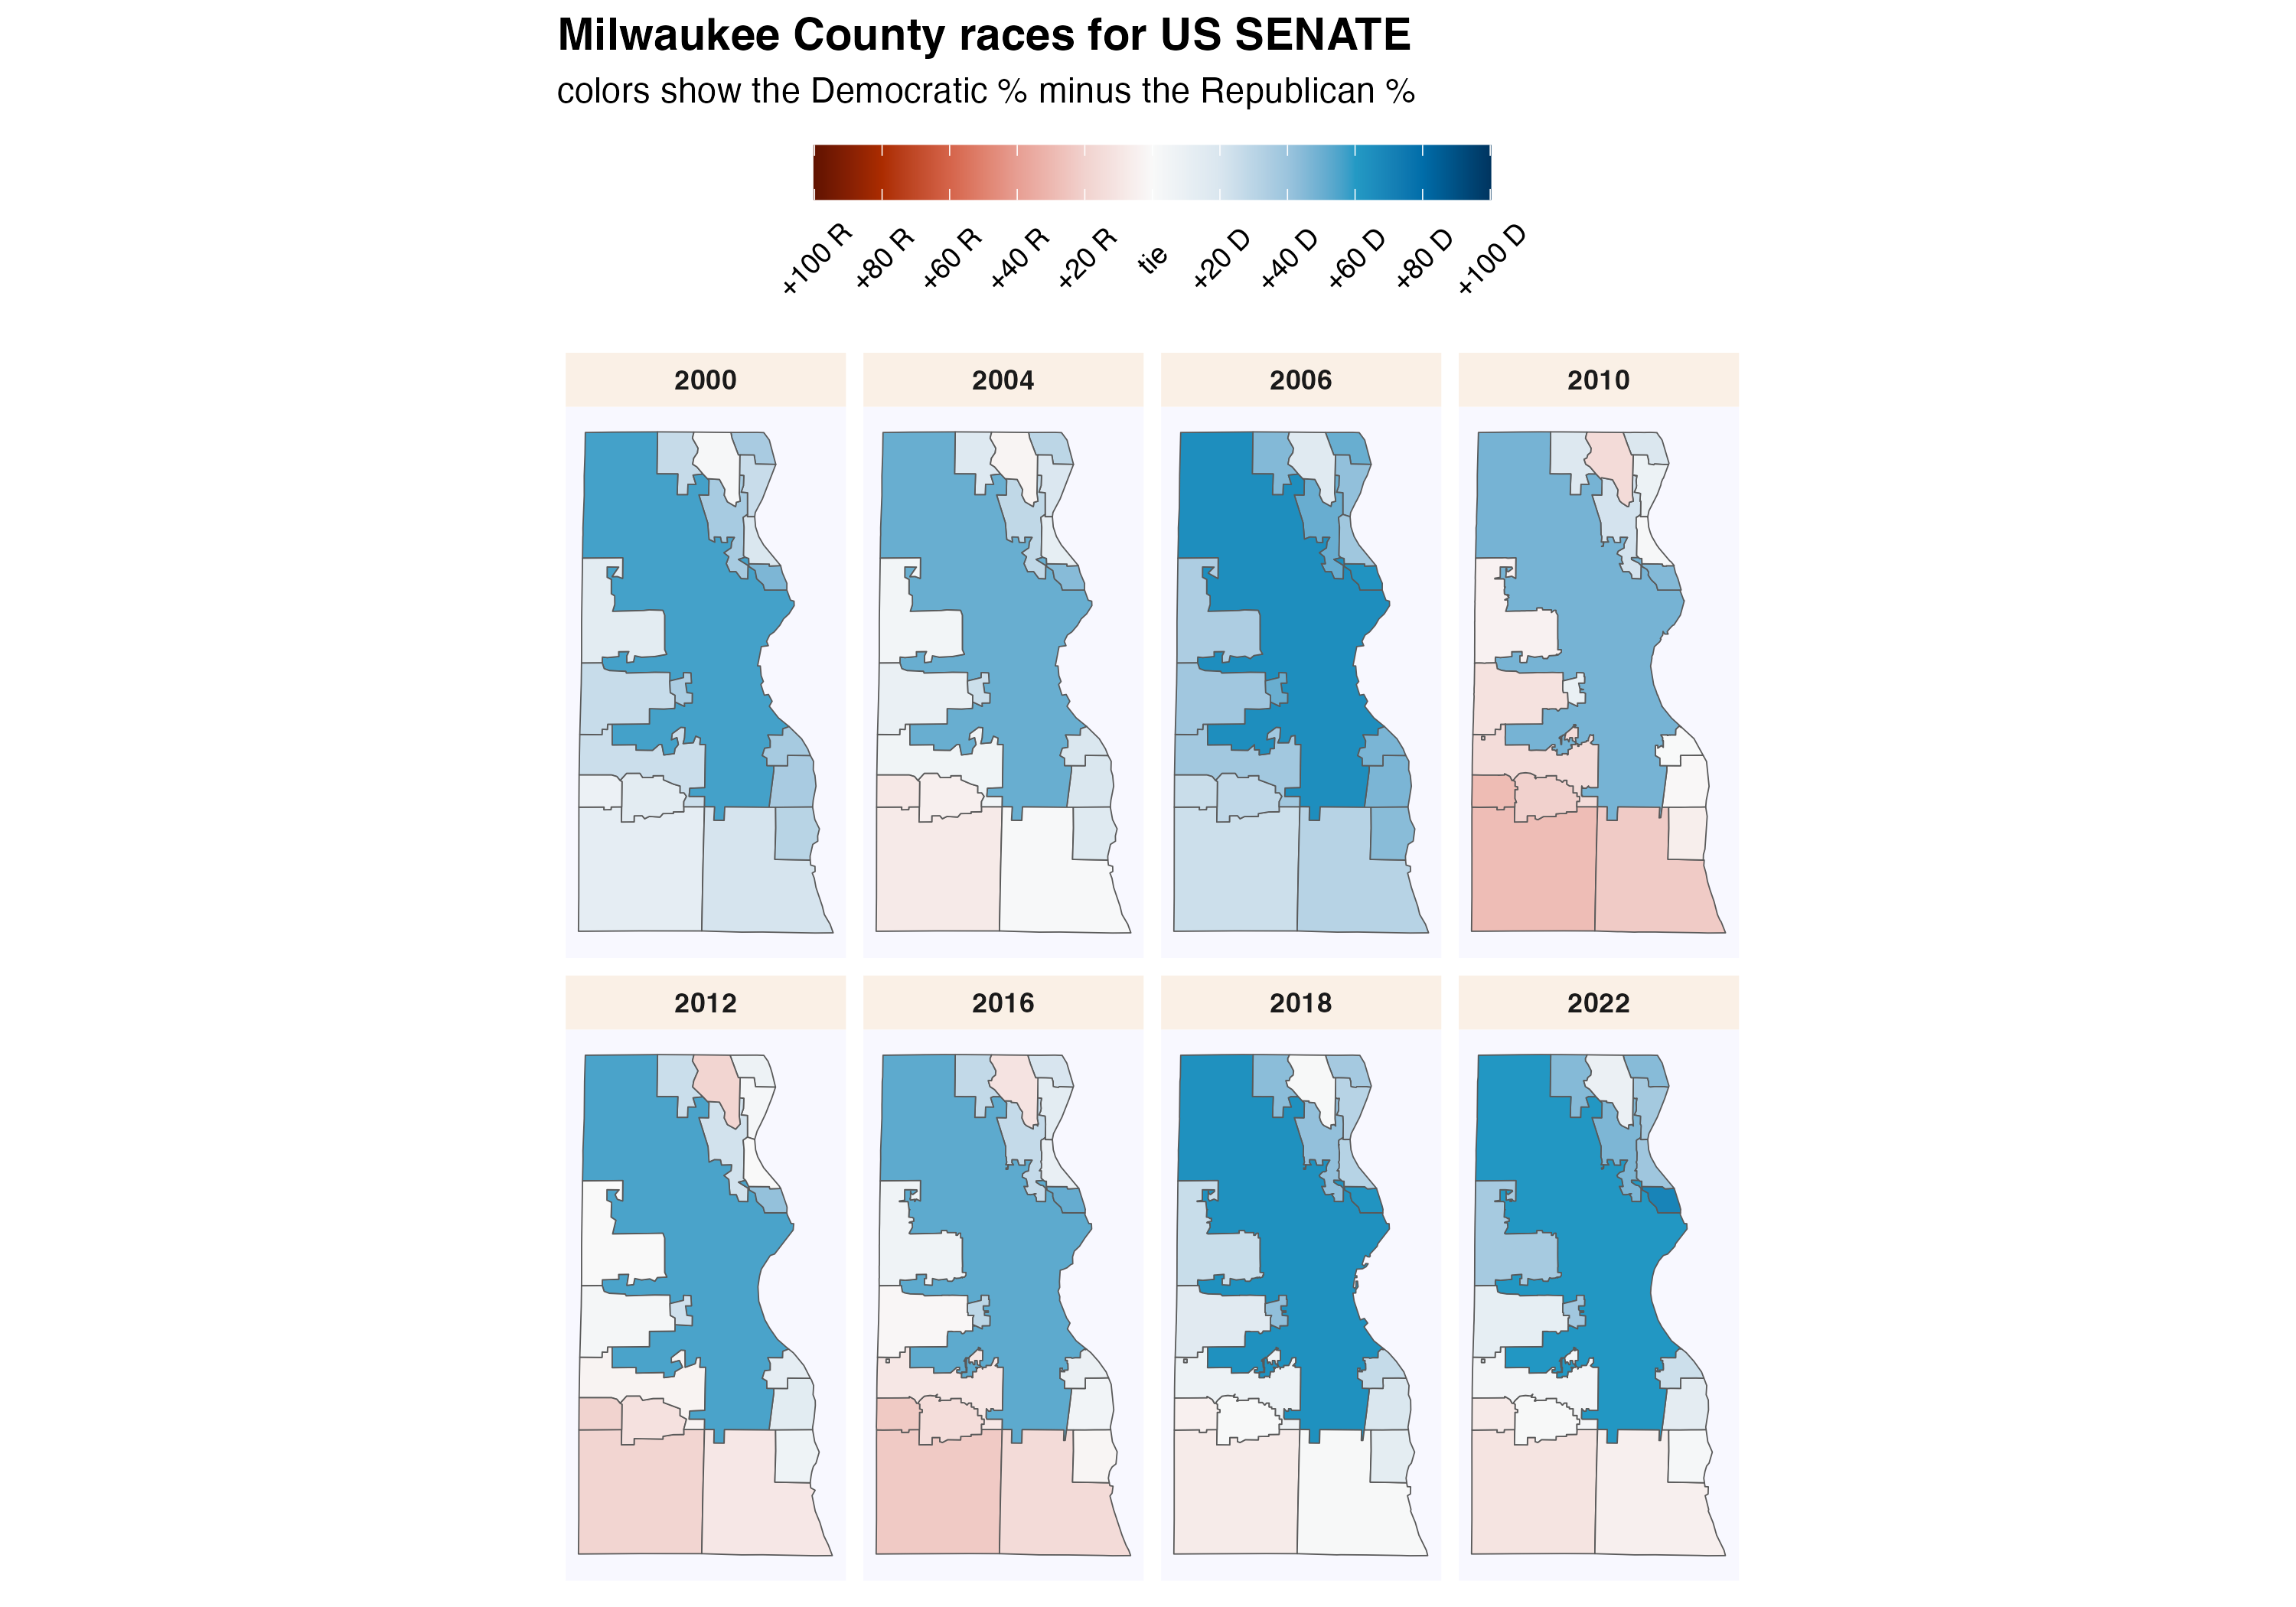
These maps show show every election result since 2000 in each municipality.
Click each column name to sort its values.
43.4 Supreme Court Election Results
Wisconsin’s Supreme Court has 7 justices, each of whom are elected to 10 year terms in statewide elections held in April. State law prohibits more than one Supreme Court election from being held in a single year. If a seat becomes vacant, the governor appoints a replacement who serves until the next year in which no court election is already scheduled. If more than two candidates achieve ballot access, a nonpartisan, top-two primary is held in February.
Court elections are formally nonpartisan, but candidates are usually supported by either liberals or conservatives. In recent years, it has become common for the Democratic and Republican parties to endorse and actively campaign on behalf of favored judicial candidates. The liberal and conservative labels indicated in the following graphs and tables are based on widely recognized tendencies, not any formal affiliation.
43.4.1 County Election Results
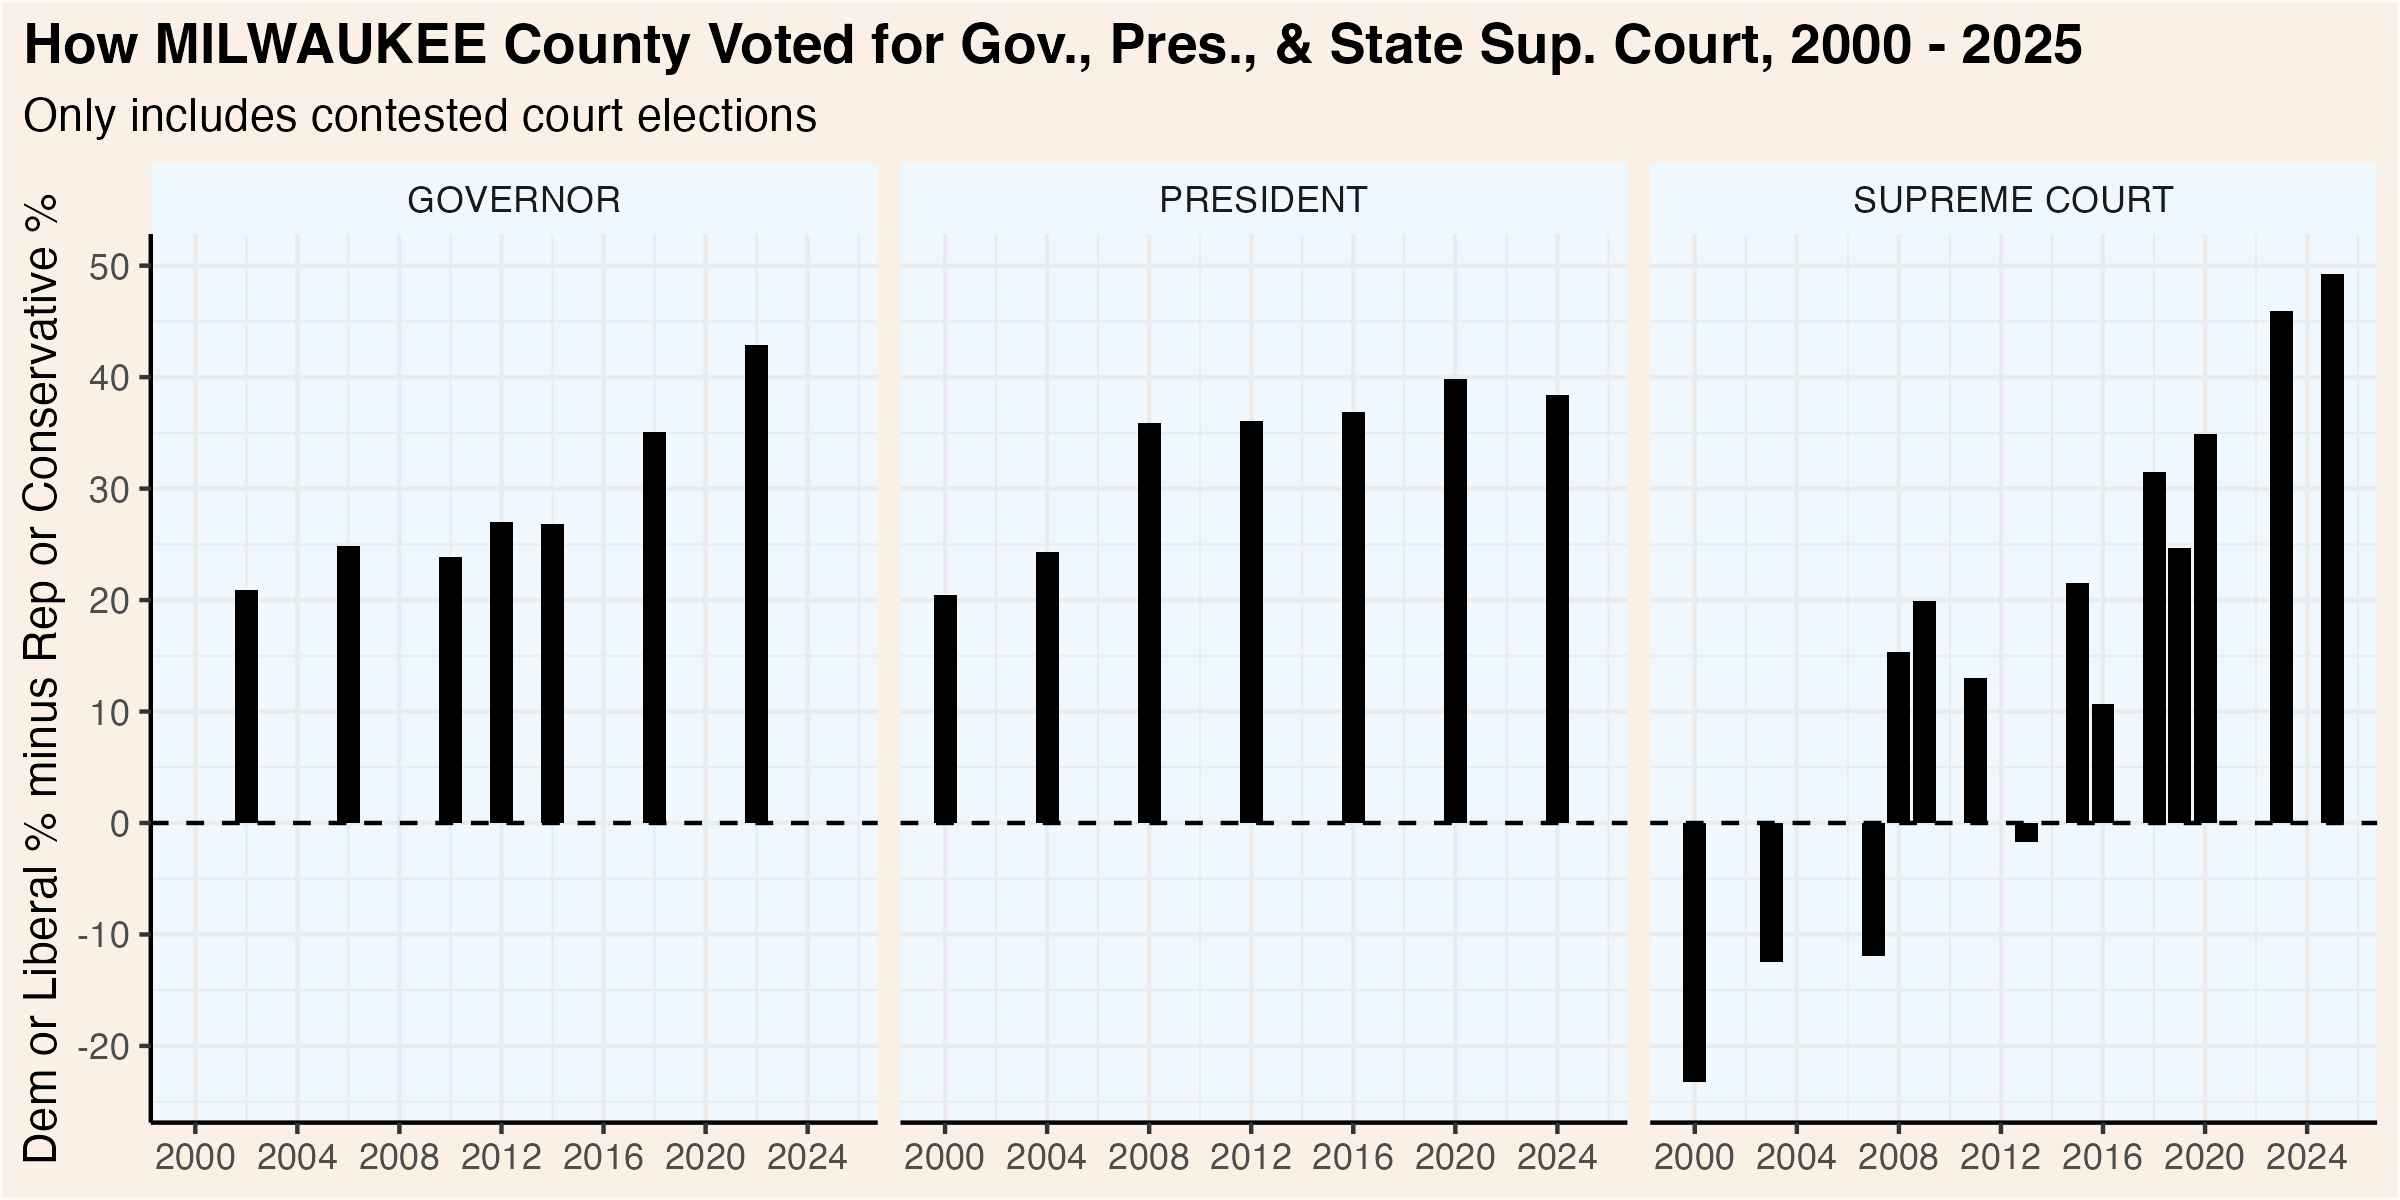
This graphic compares how presidential, gubernatorial, and court elections have trended over the past quarter century. Click the “Table” tab to see detailed results for the Supreme Court races.
43.4.2 Municipality Election Results
The following table shows the results of each Supreme Court election by municipality. The graphic visualizes the shifts over the past three court elections.