Political & Demographic statistics for every county
demographic overview
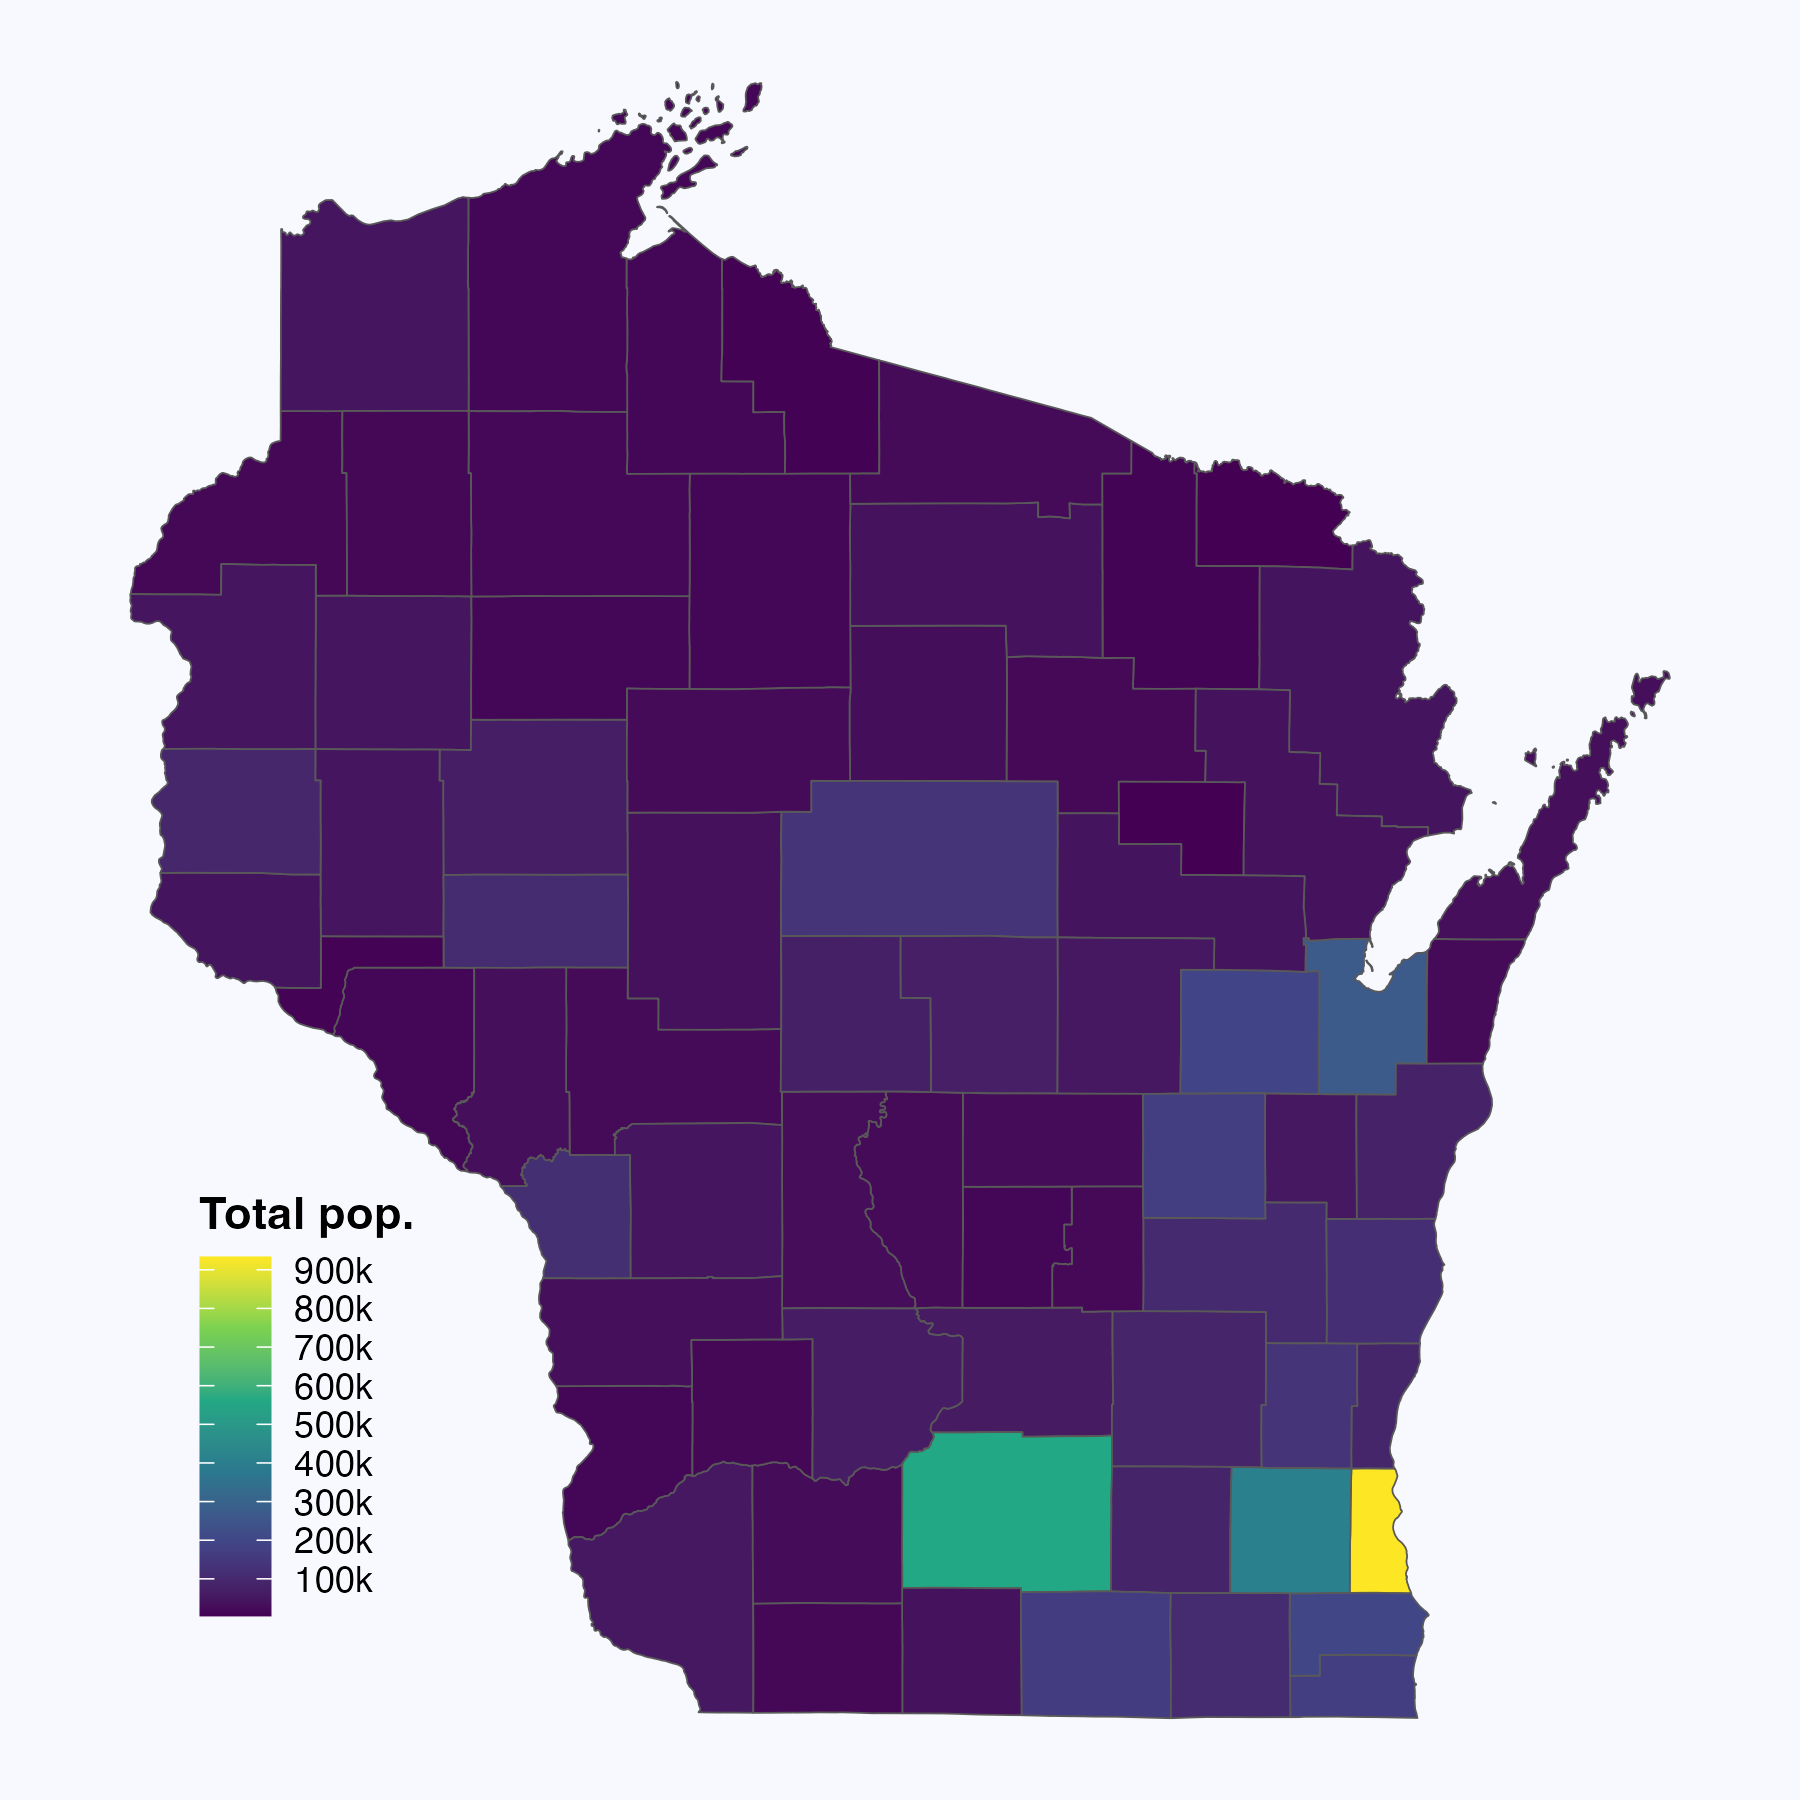
Wisconsin is divided into 72 counties, the largest nine of which hold 52% of the state’s population. These largest counties themselves represent several distinct population clusters in the state. These include Milwaukee, Racine, and Kenosha in southeastern Wisconsin; Dane County in central Wisconsin; Rock on the Illinois border; and a series of cities stretching along Lake Winnebago to Green Bay through Winnebago, Outagamie, and Brown counties. Other major population centers include Marathon County in north central Wisconsin, Eau Claire in northwestern Wisconsin, and La Crosse on border with Minnesota.
The largest, Milwaukee County, holds about 16% of the state’s population, and the second largest, Dane, includes another 10%. Milwaukee County is by far the most racially diverse county in the state. It contains 10% of Wisconsin’s white population, 22% of Native Americans, 26% of Asian residents, 35% of Hispanic or Latino Wisconsinites, and 67% of Black people living in Wisconsin. Other significant pockets of Native American residents exist in northern Wisconsin, particularly in and around the state’s several reservations.
The following maps and table show additional detailed statistics for each county.
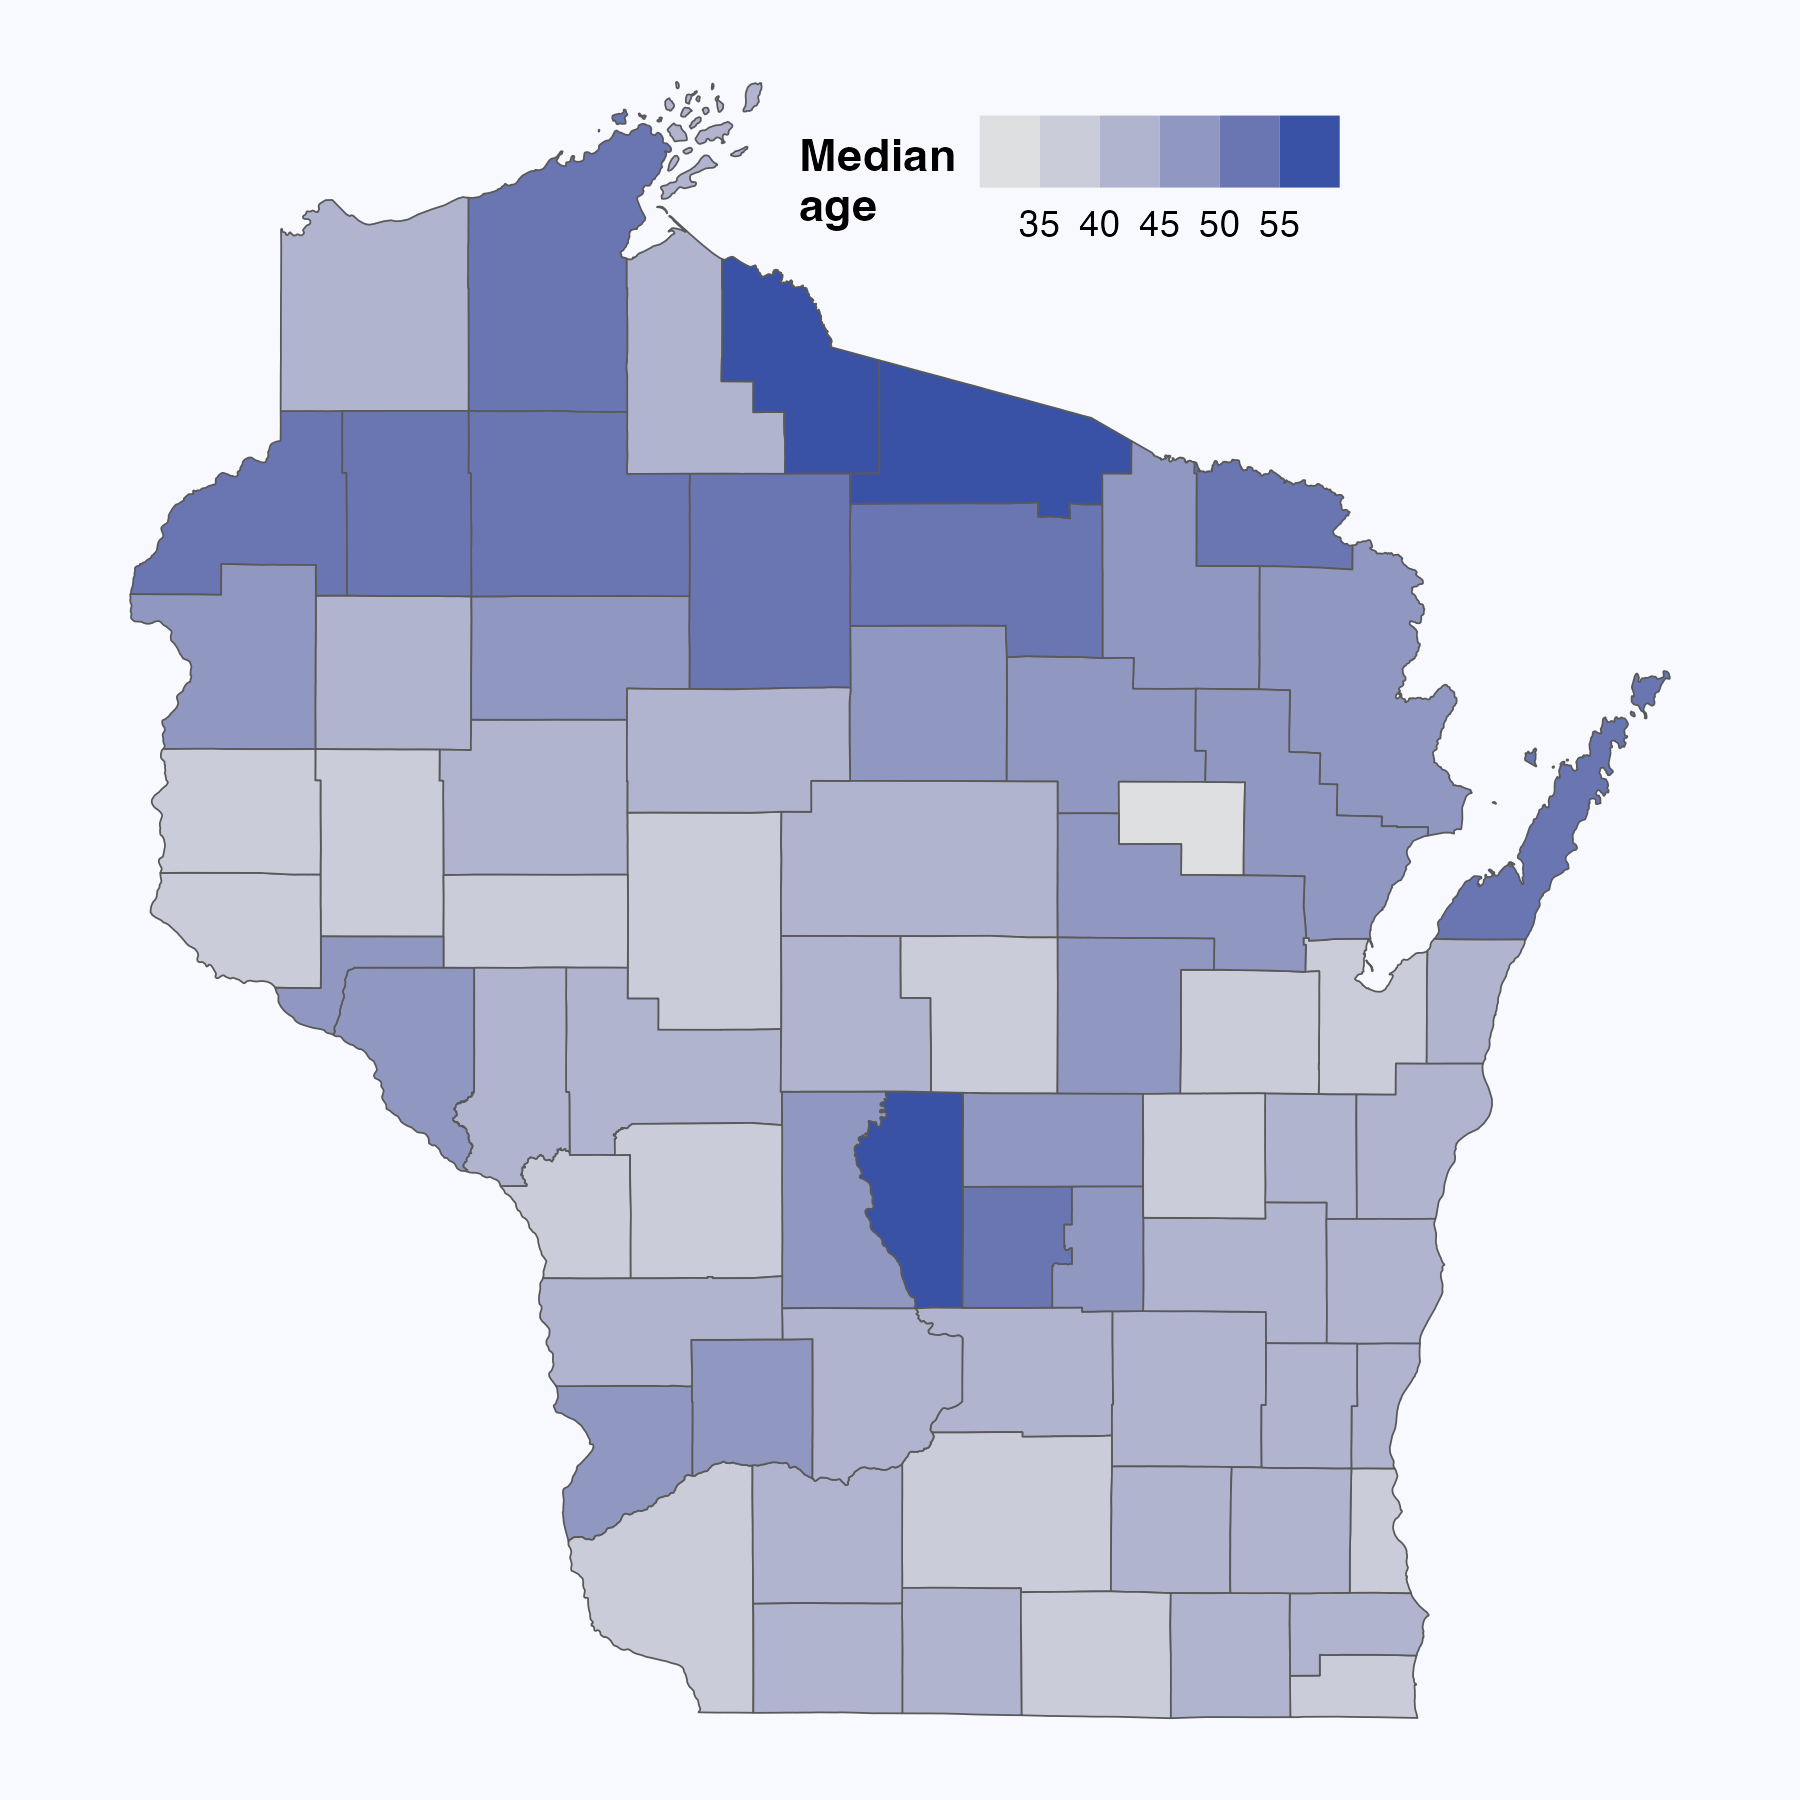
- In general, Wisconsin’s oldest counties are found to the rural north, while the counties surrounding urban areas are younger.
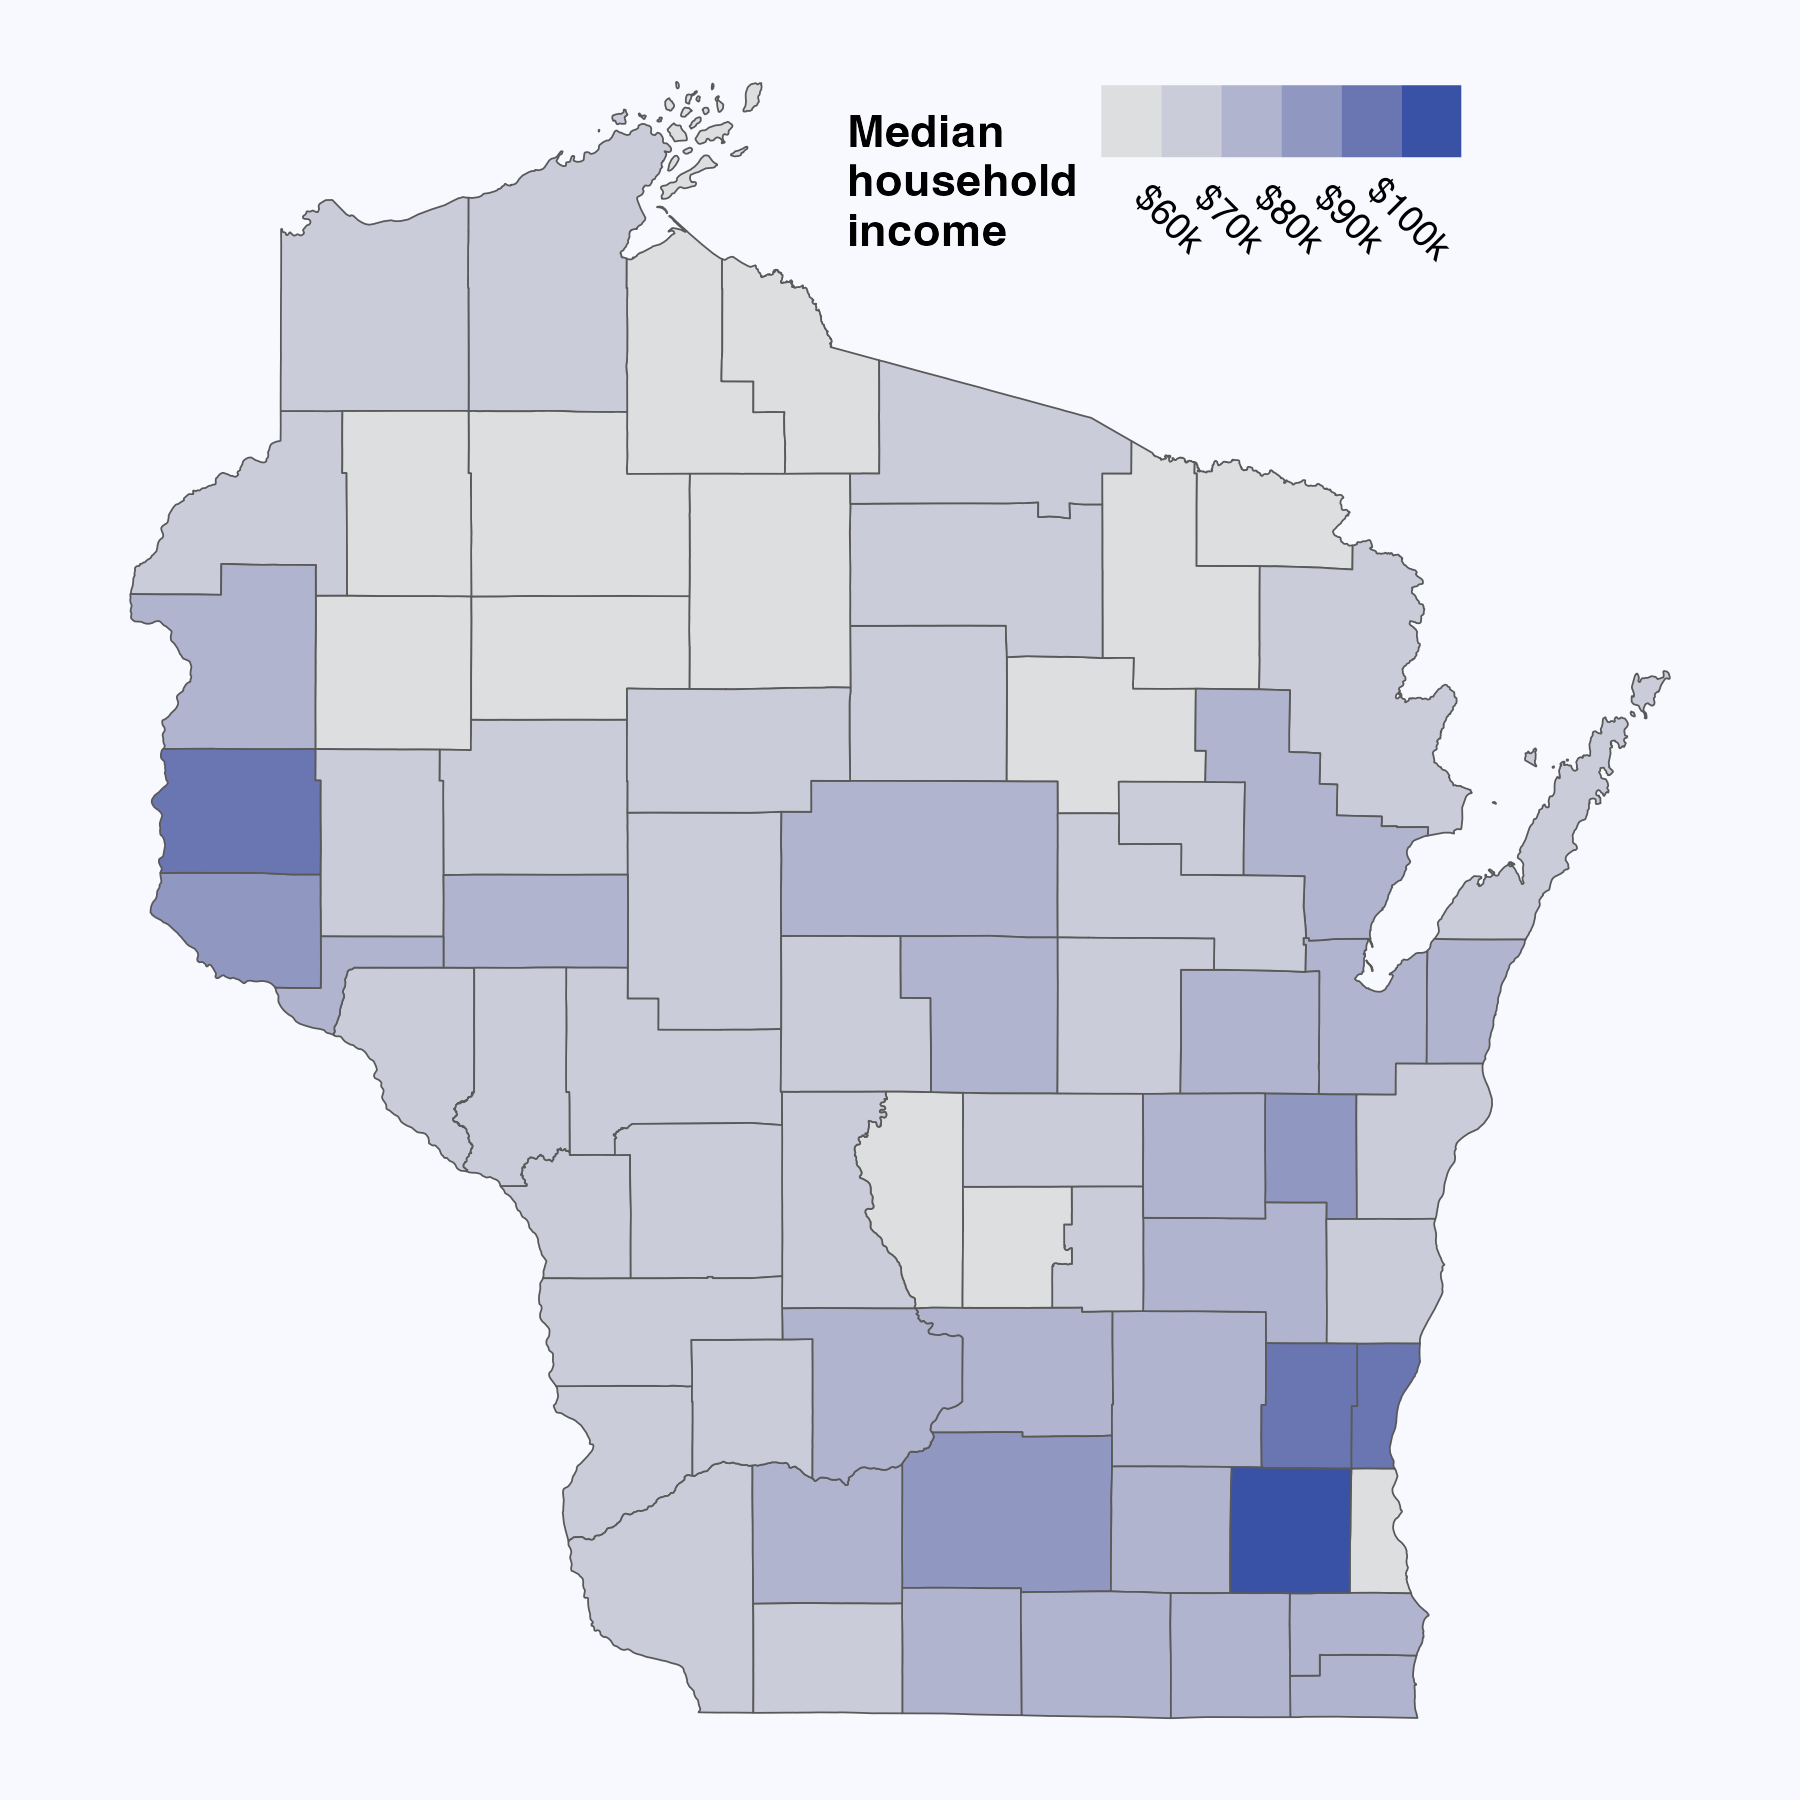
- Household incomes are highest in Dane County as well as the suburban counties in the Milwaukee and Twin Cities metros. Median incomes are lowest in many of the rural northern counties with many single retirees.
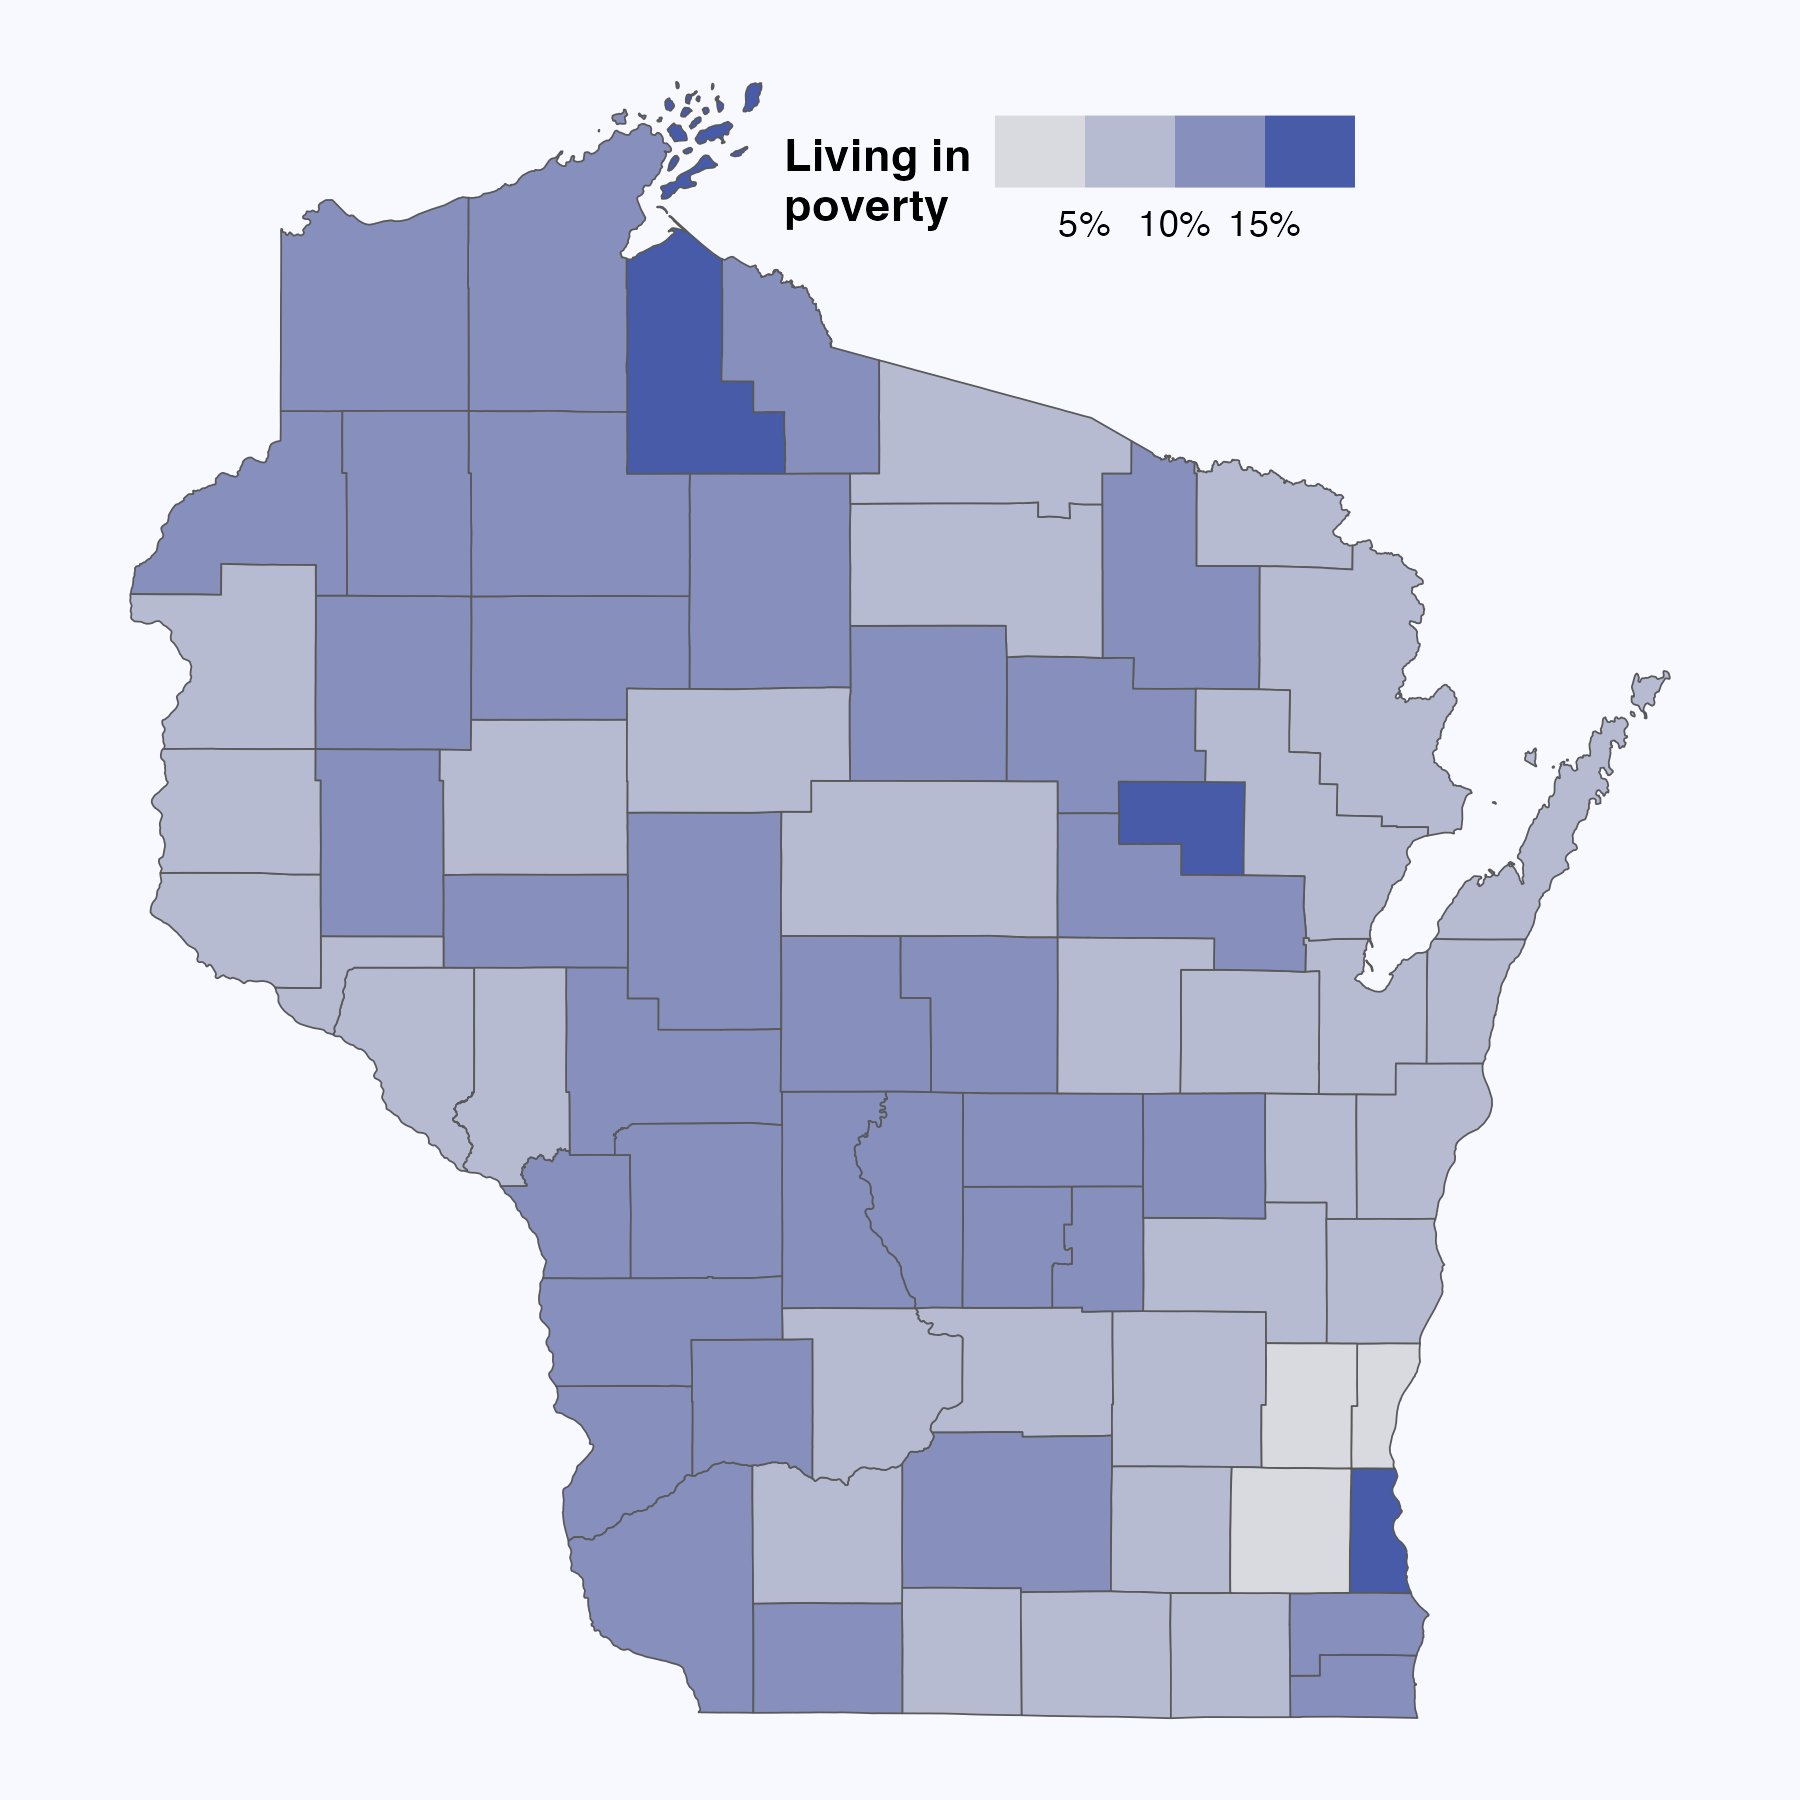
- The poverty rate is lowest in the Milwaukee county suburbs and highest in Milwaukee, Menominee, and Ashland counties.
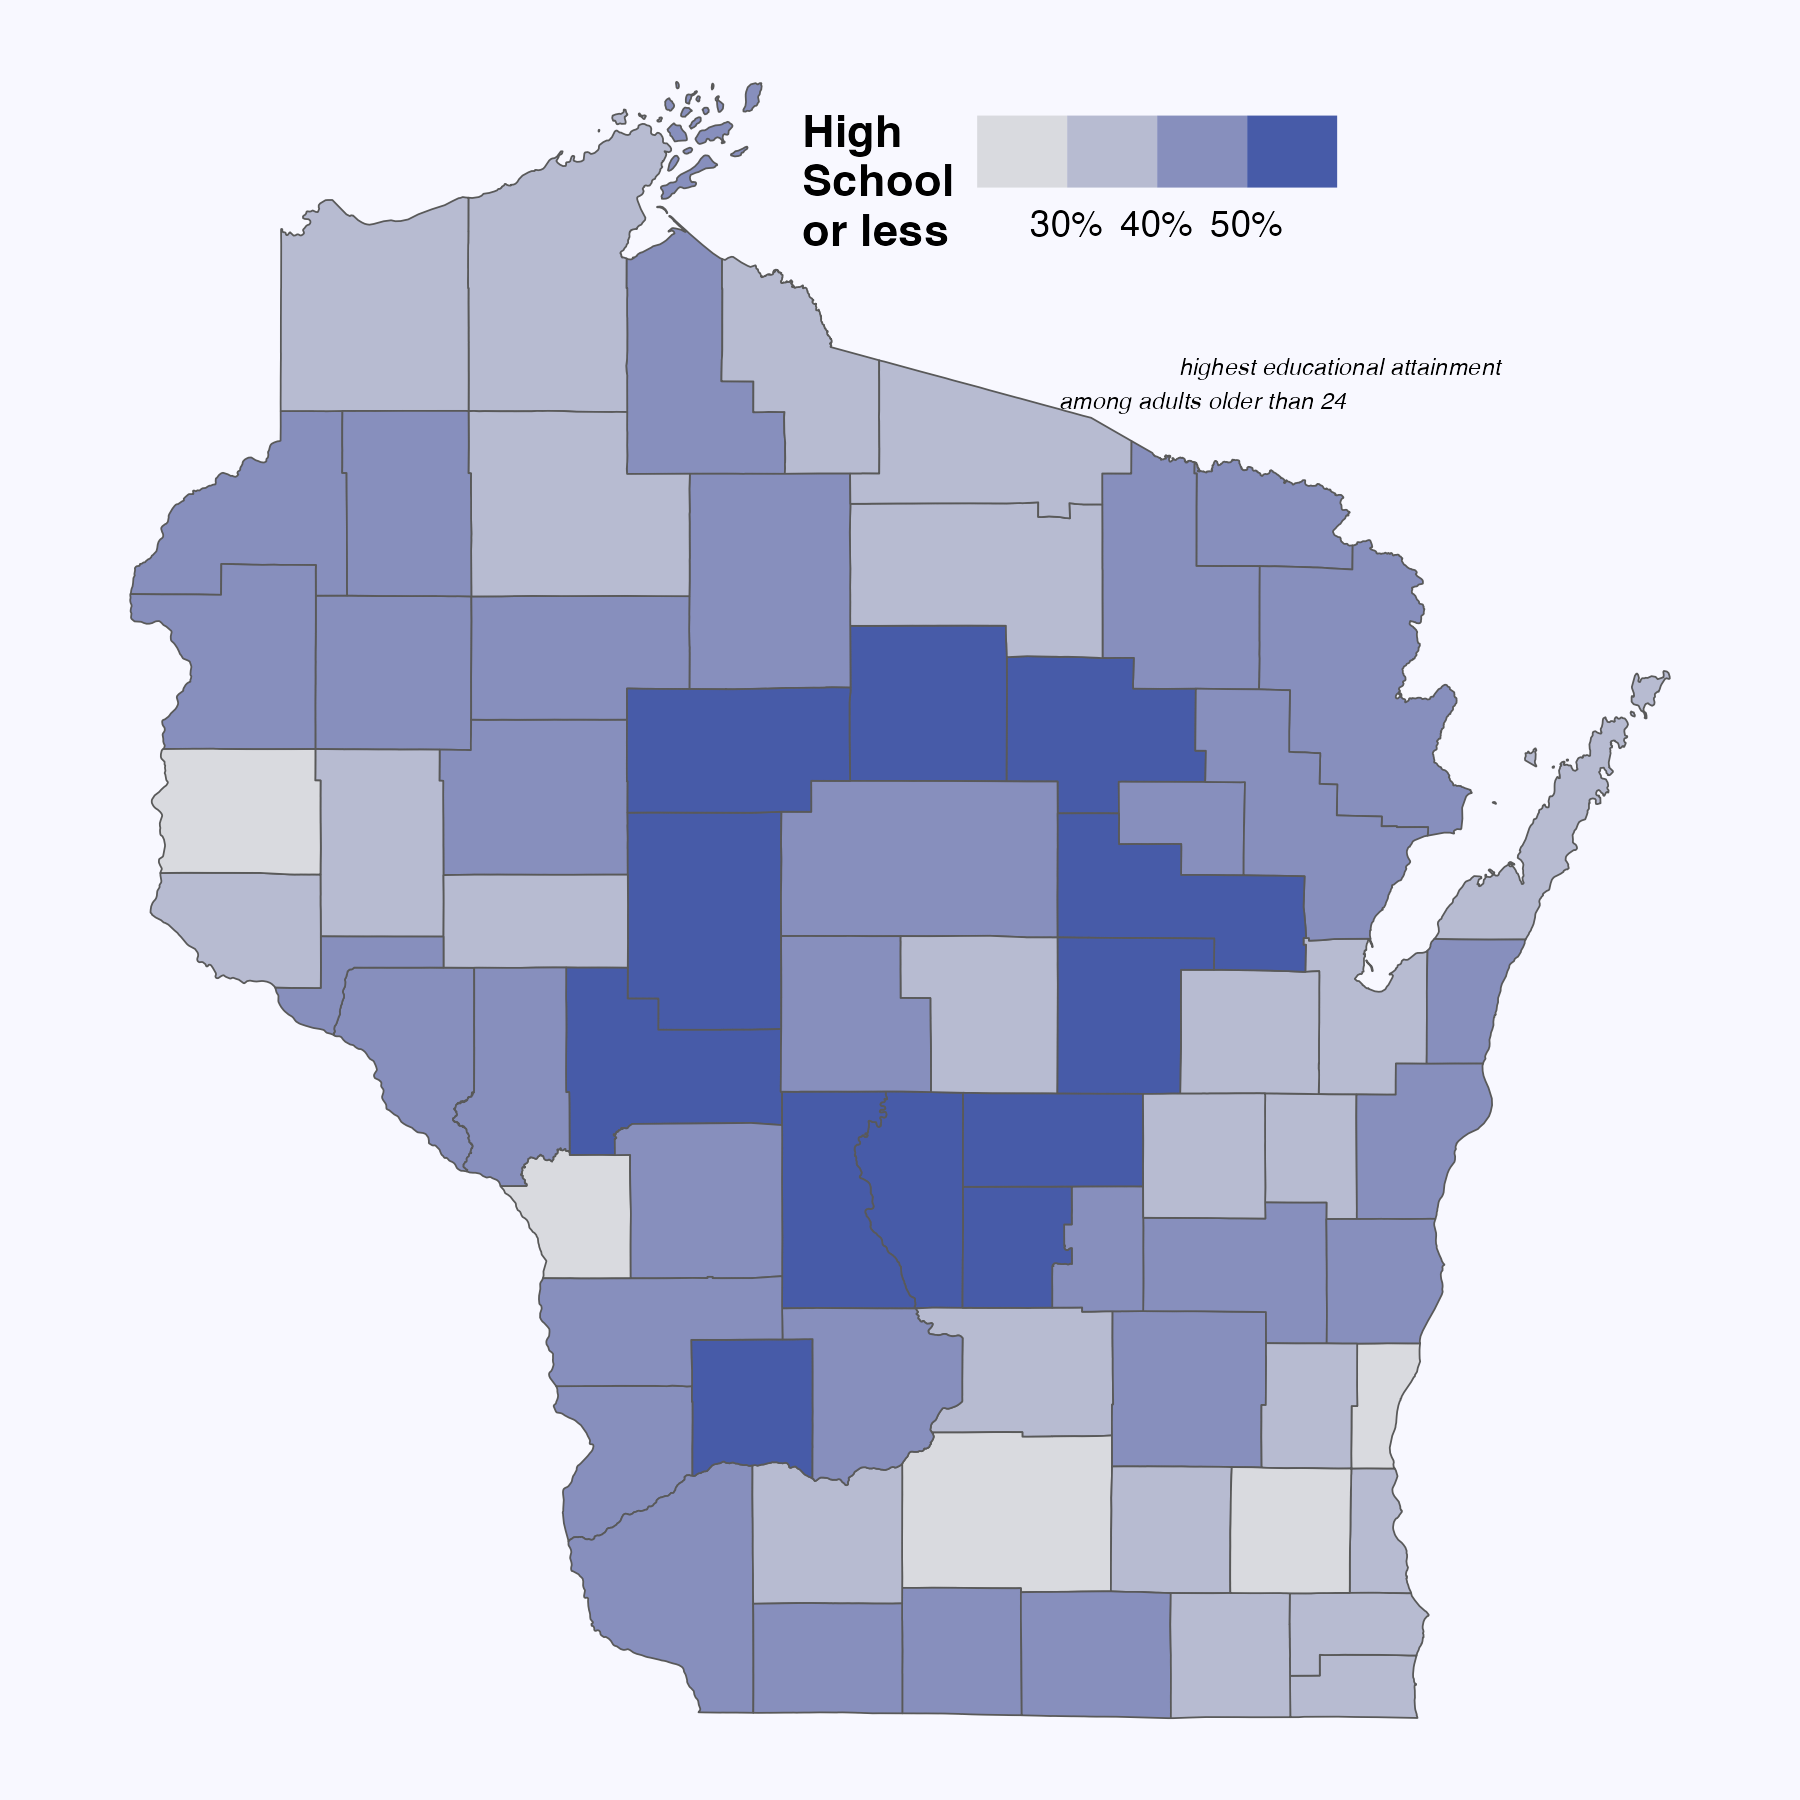
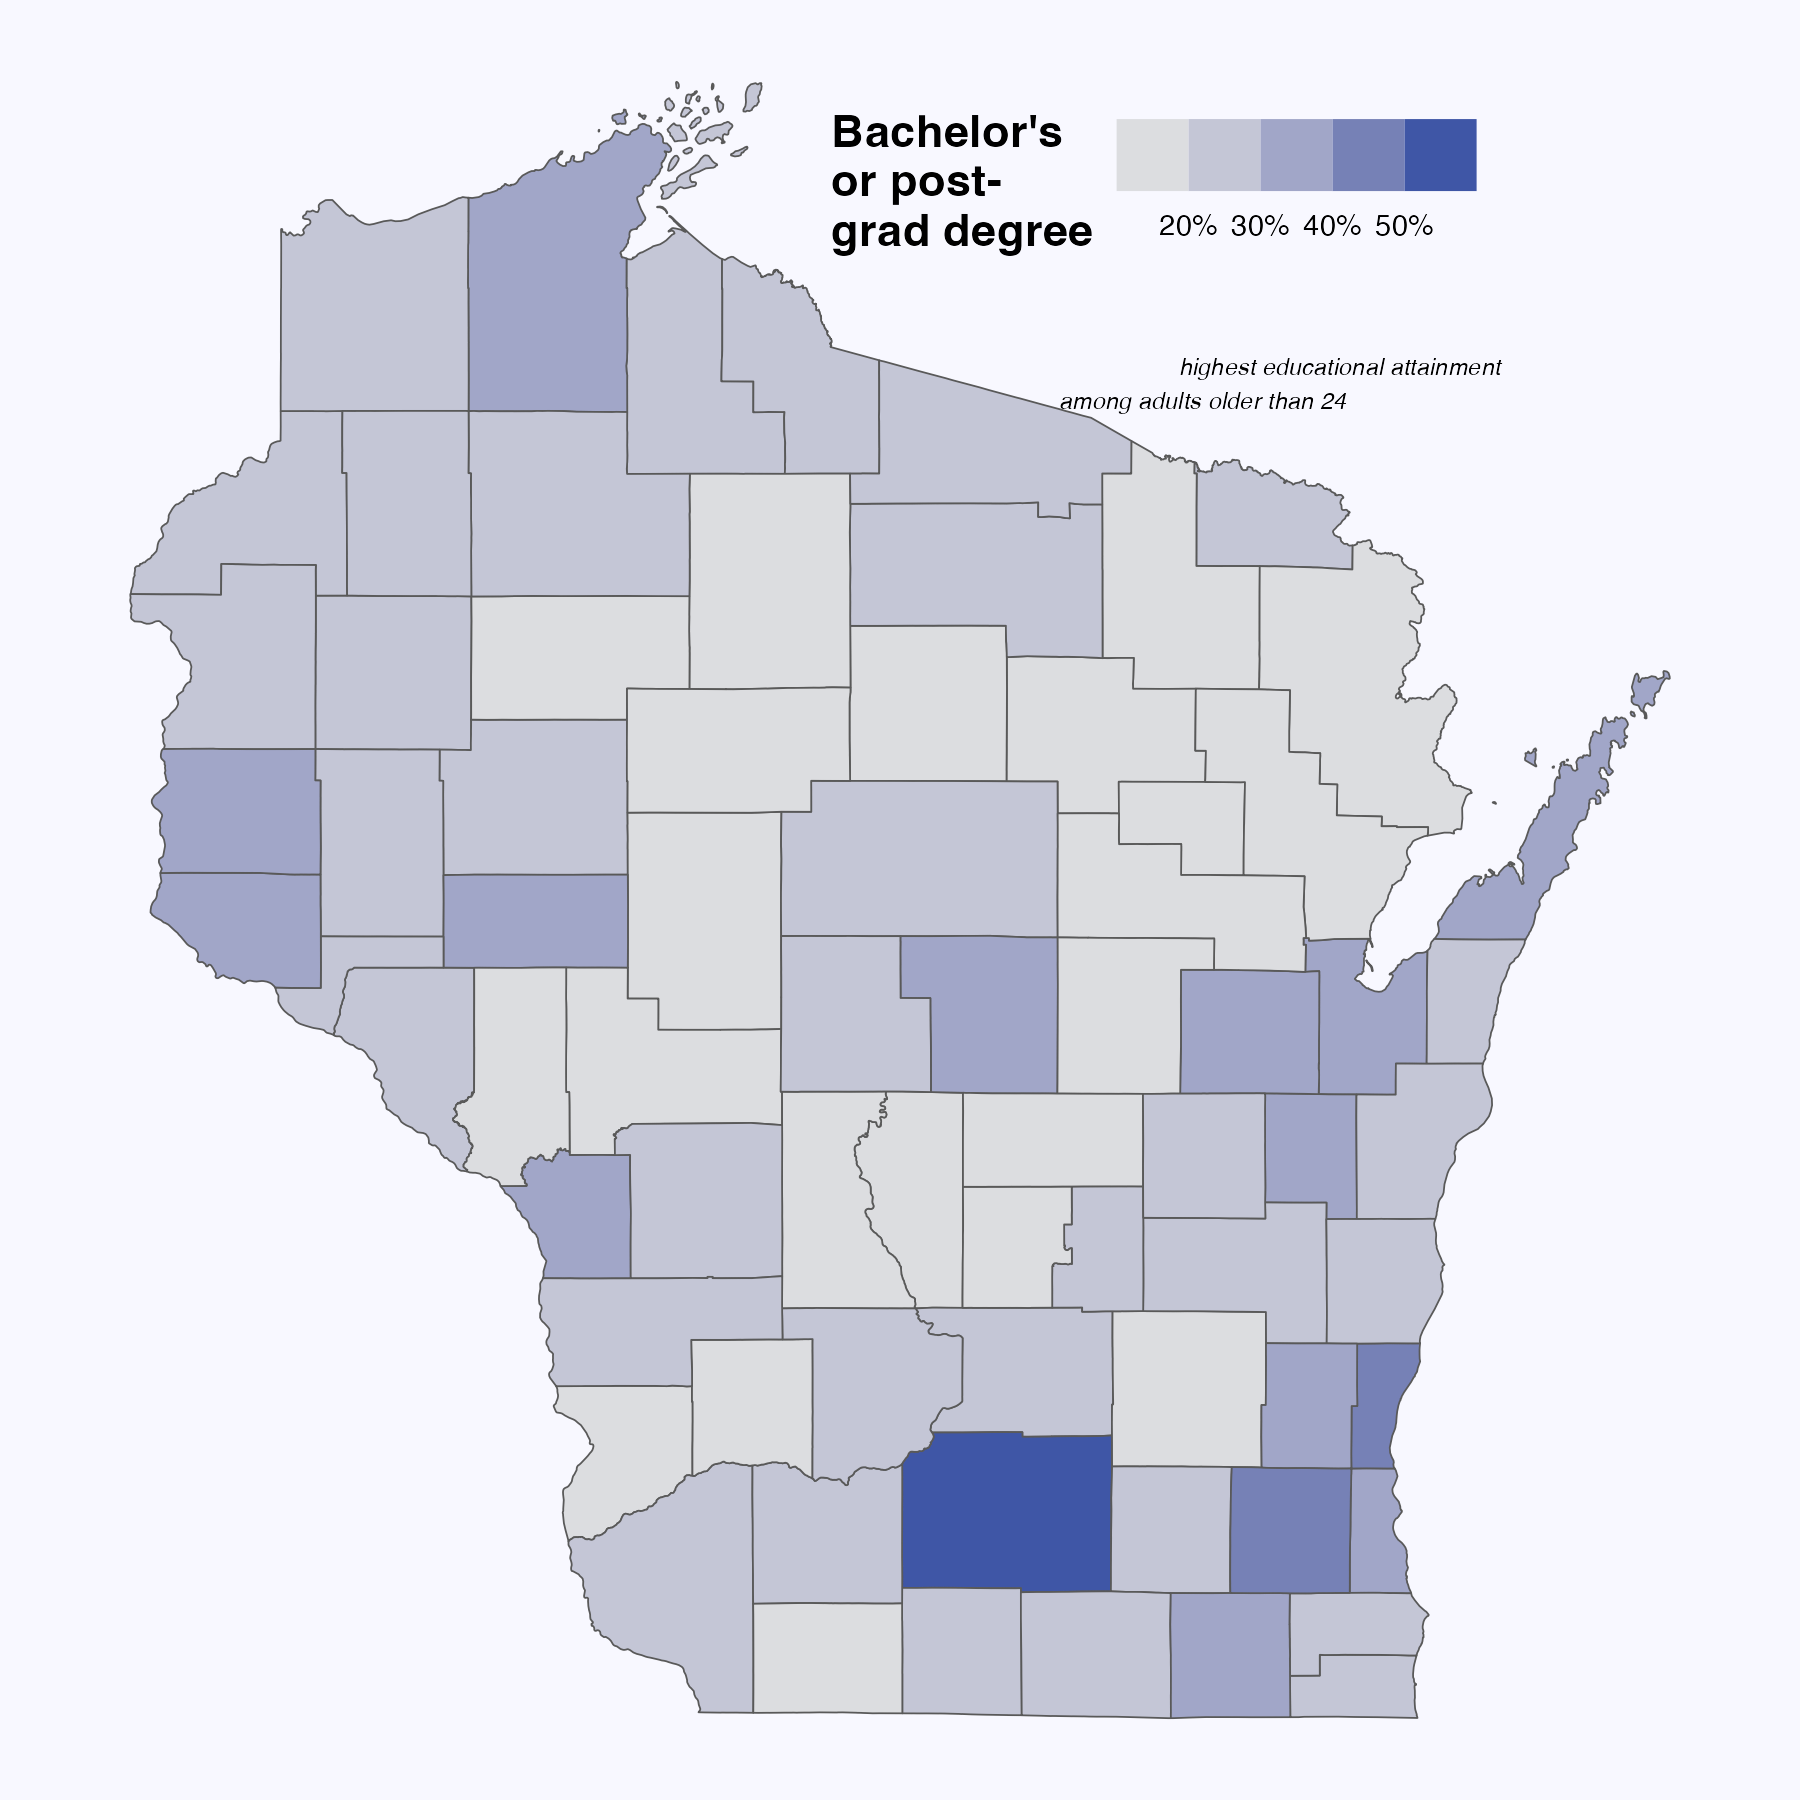
- Educational attainment is highest in Dane County, home to the state capitol and flagship state university. Other areas with higher-than-average levels of education include the Milwaukee metro and the Fox Valley. The lowest levels of educational attainment are in a ring of central Wisconsin counties surrounding (but not including) Marathon, Wood, and Portage counties.
vote maps
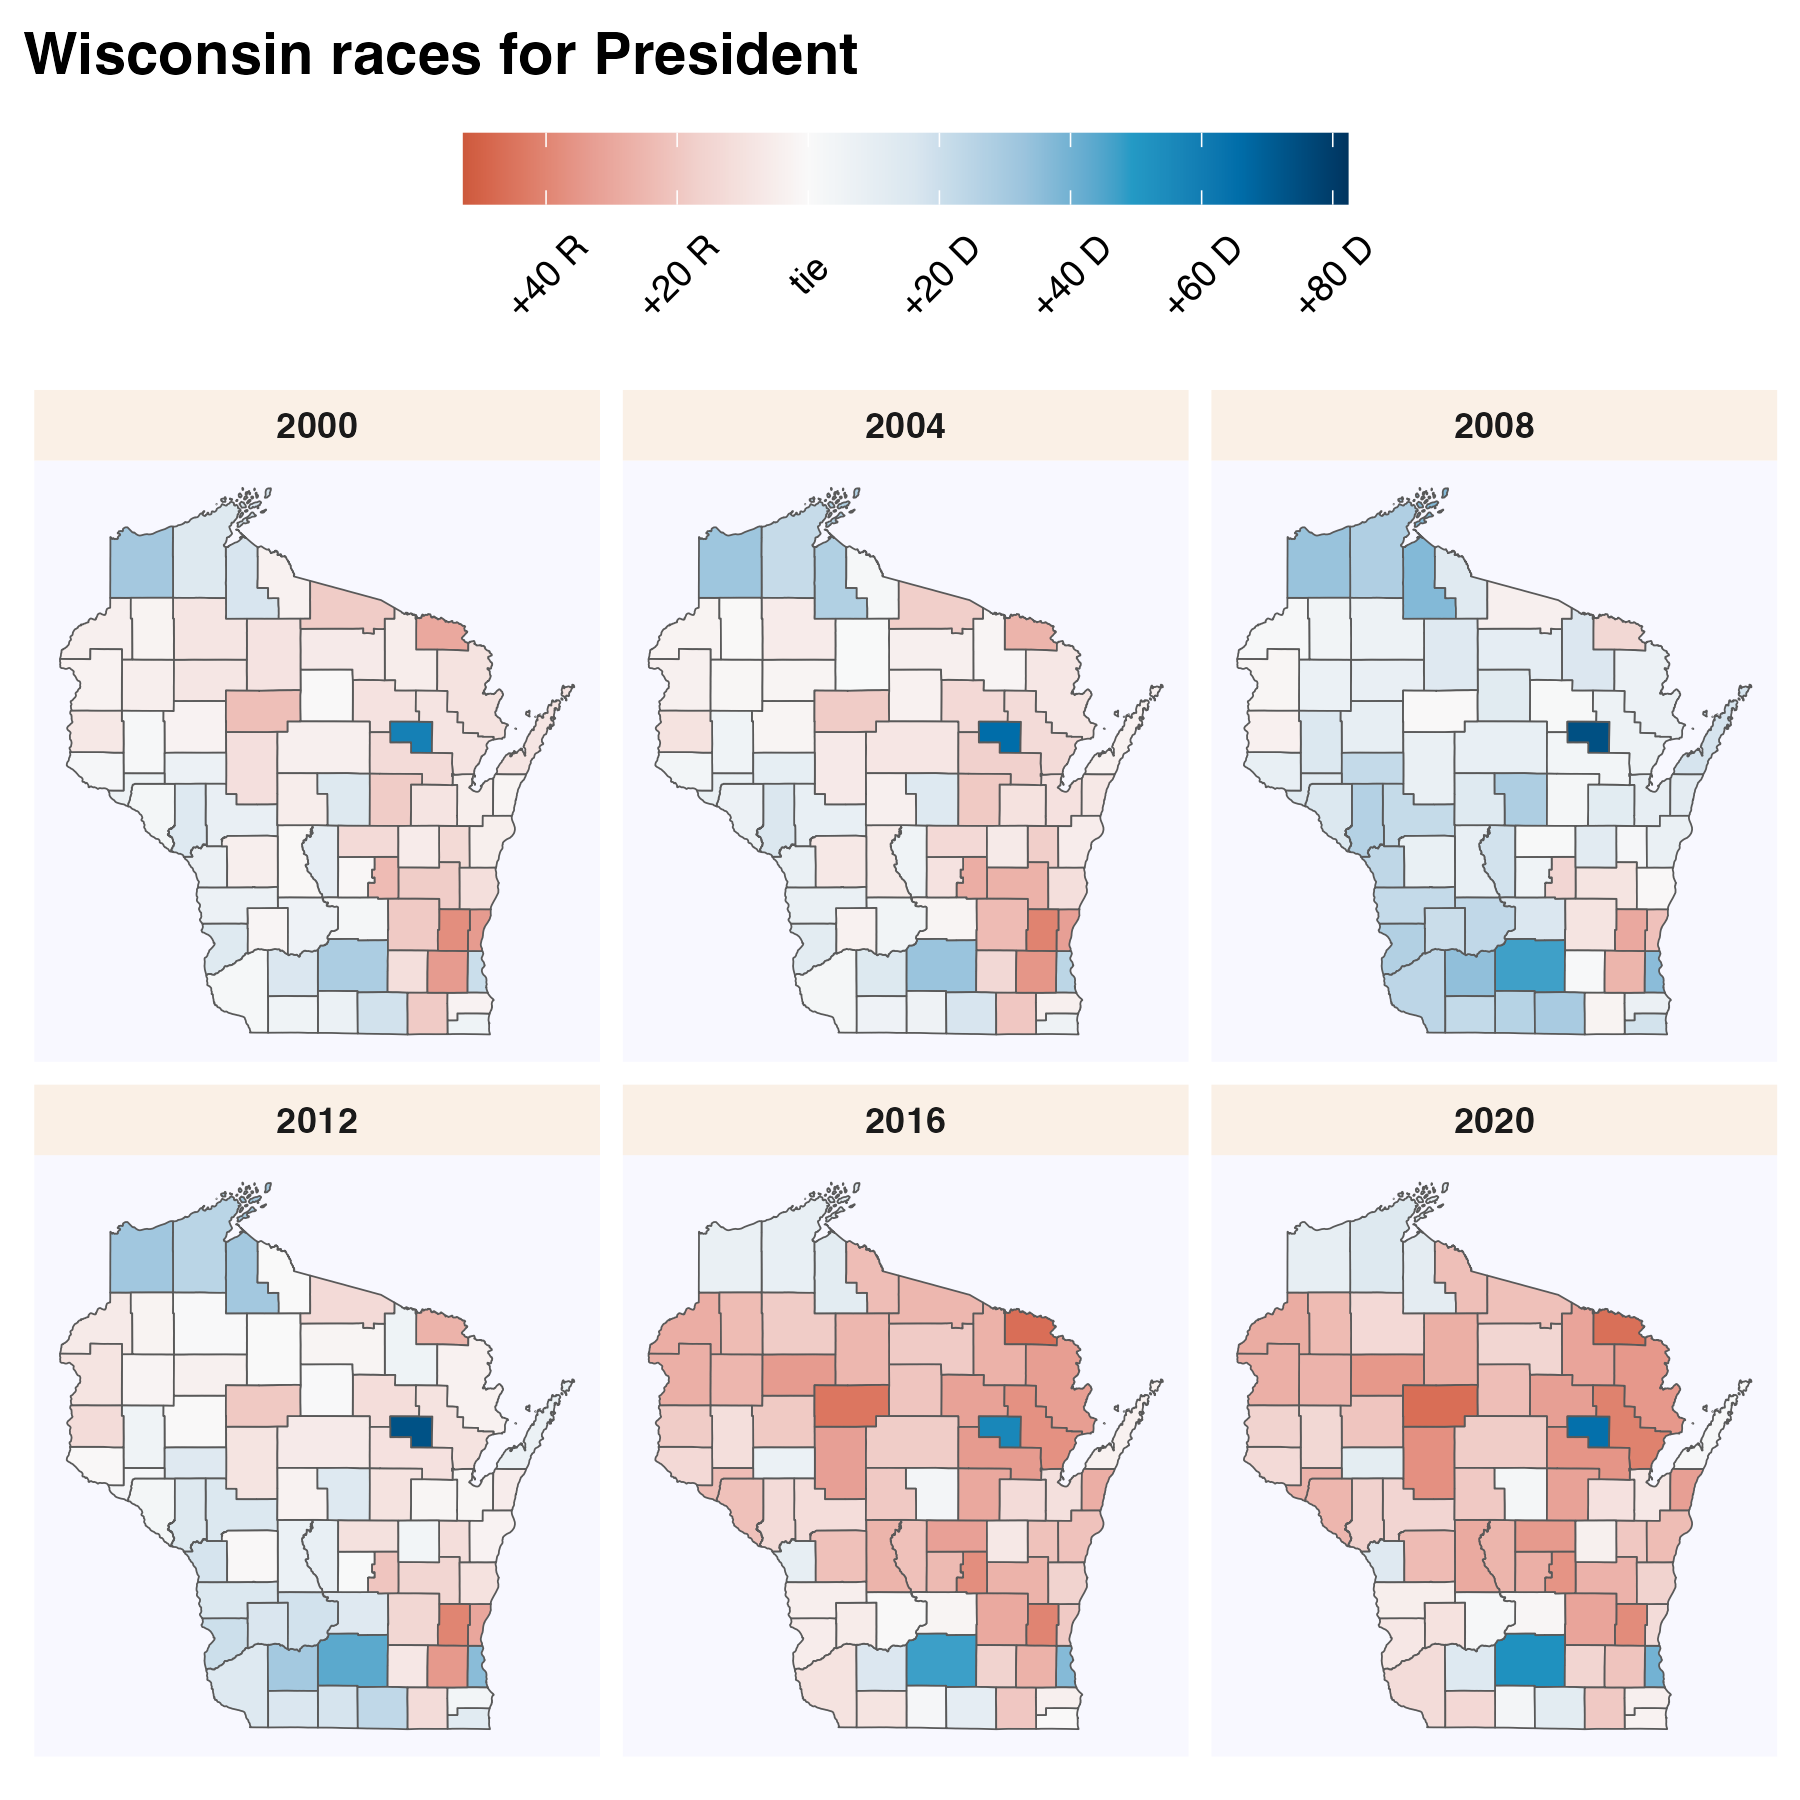
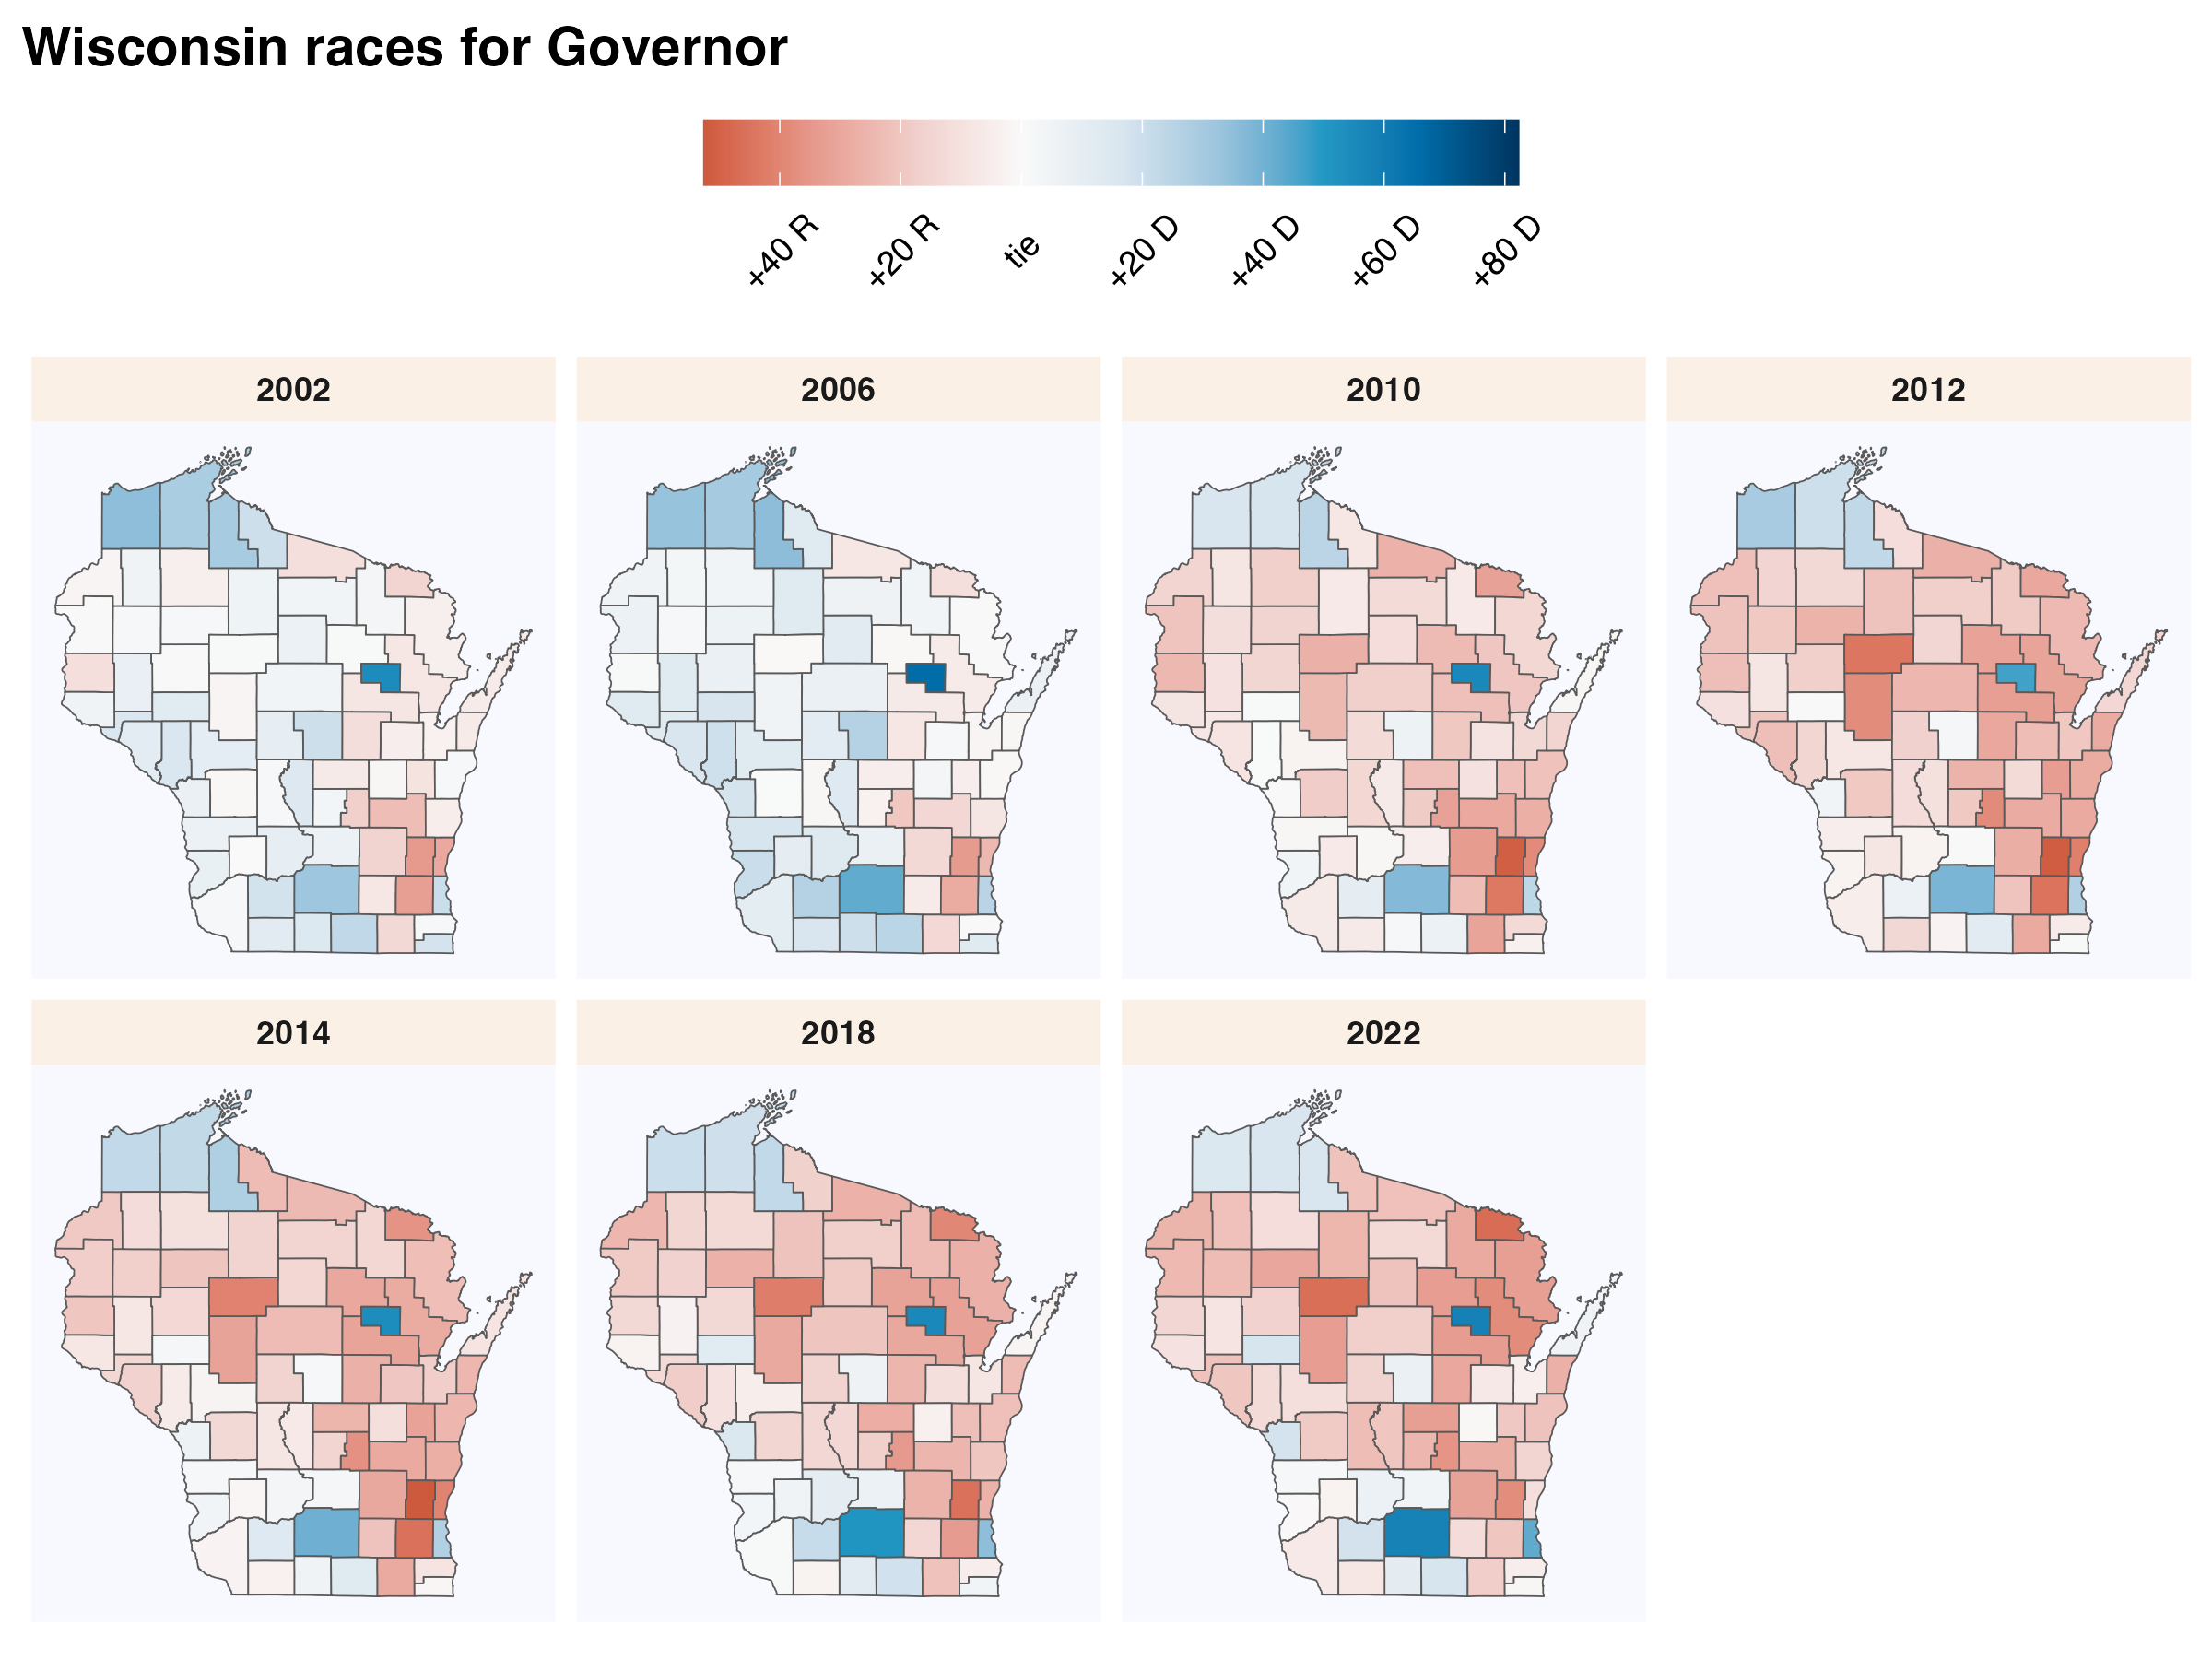
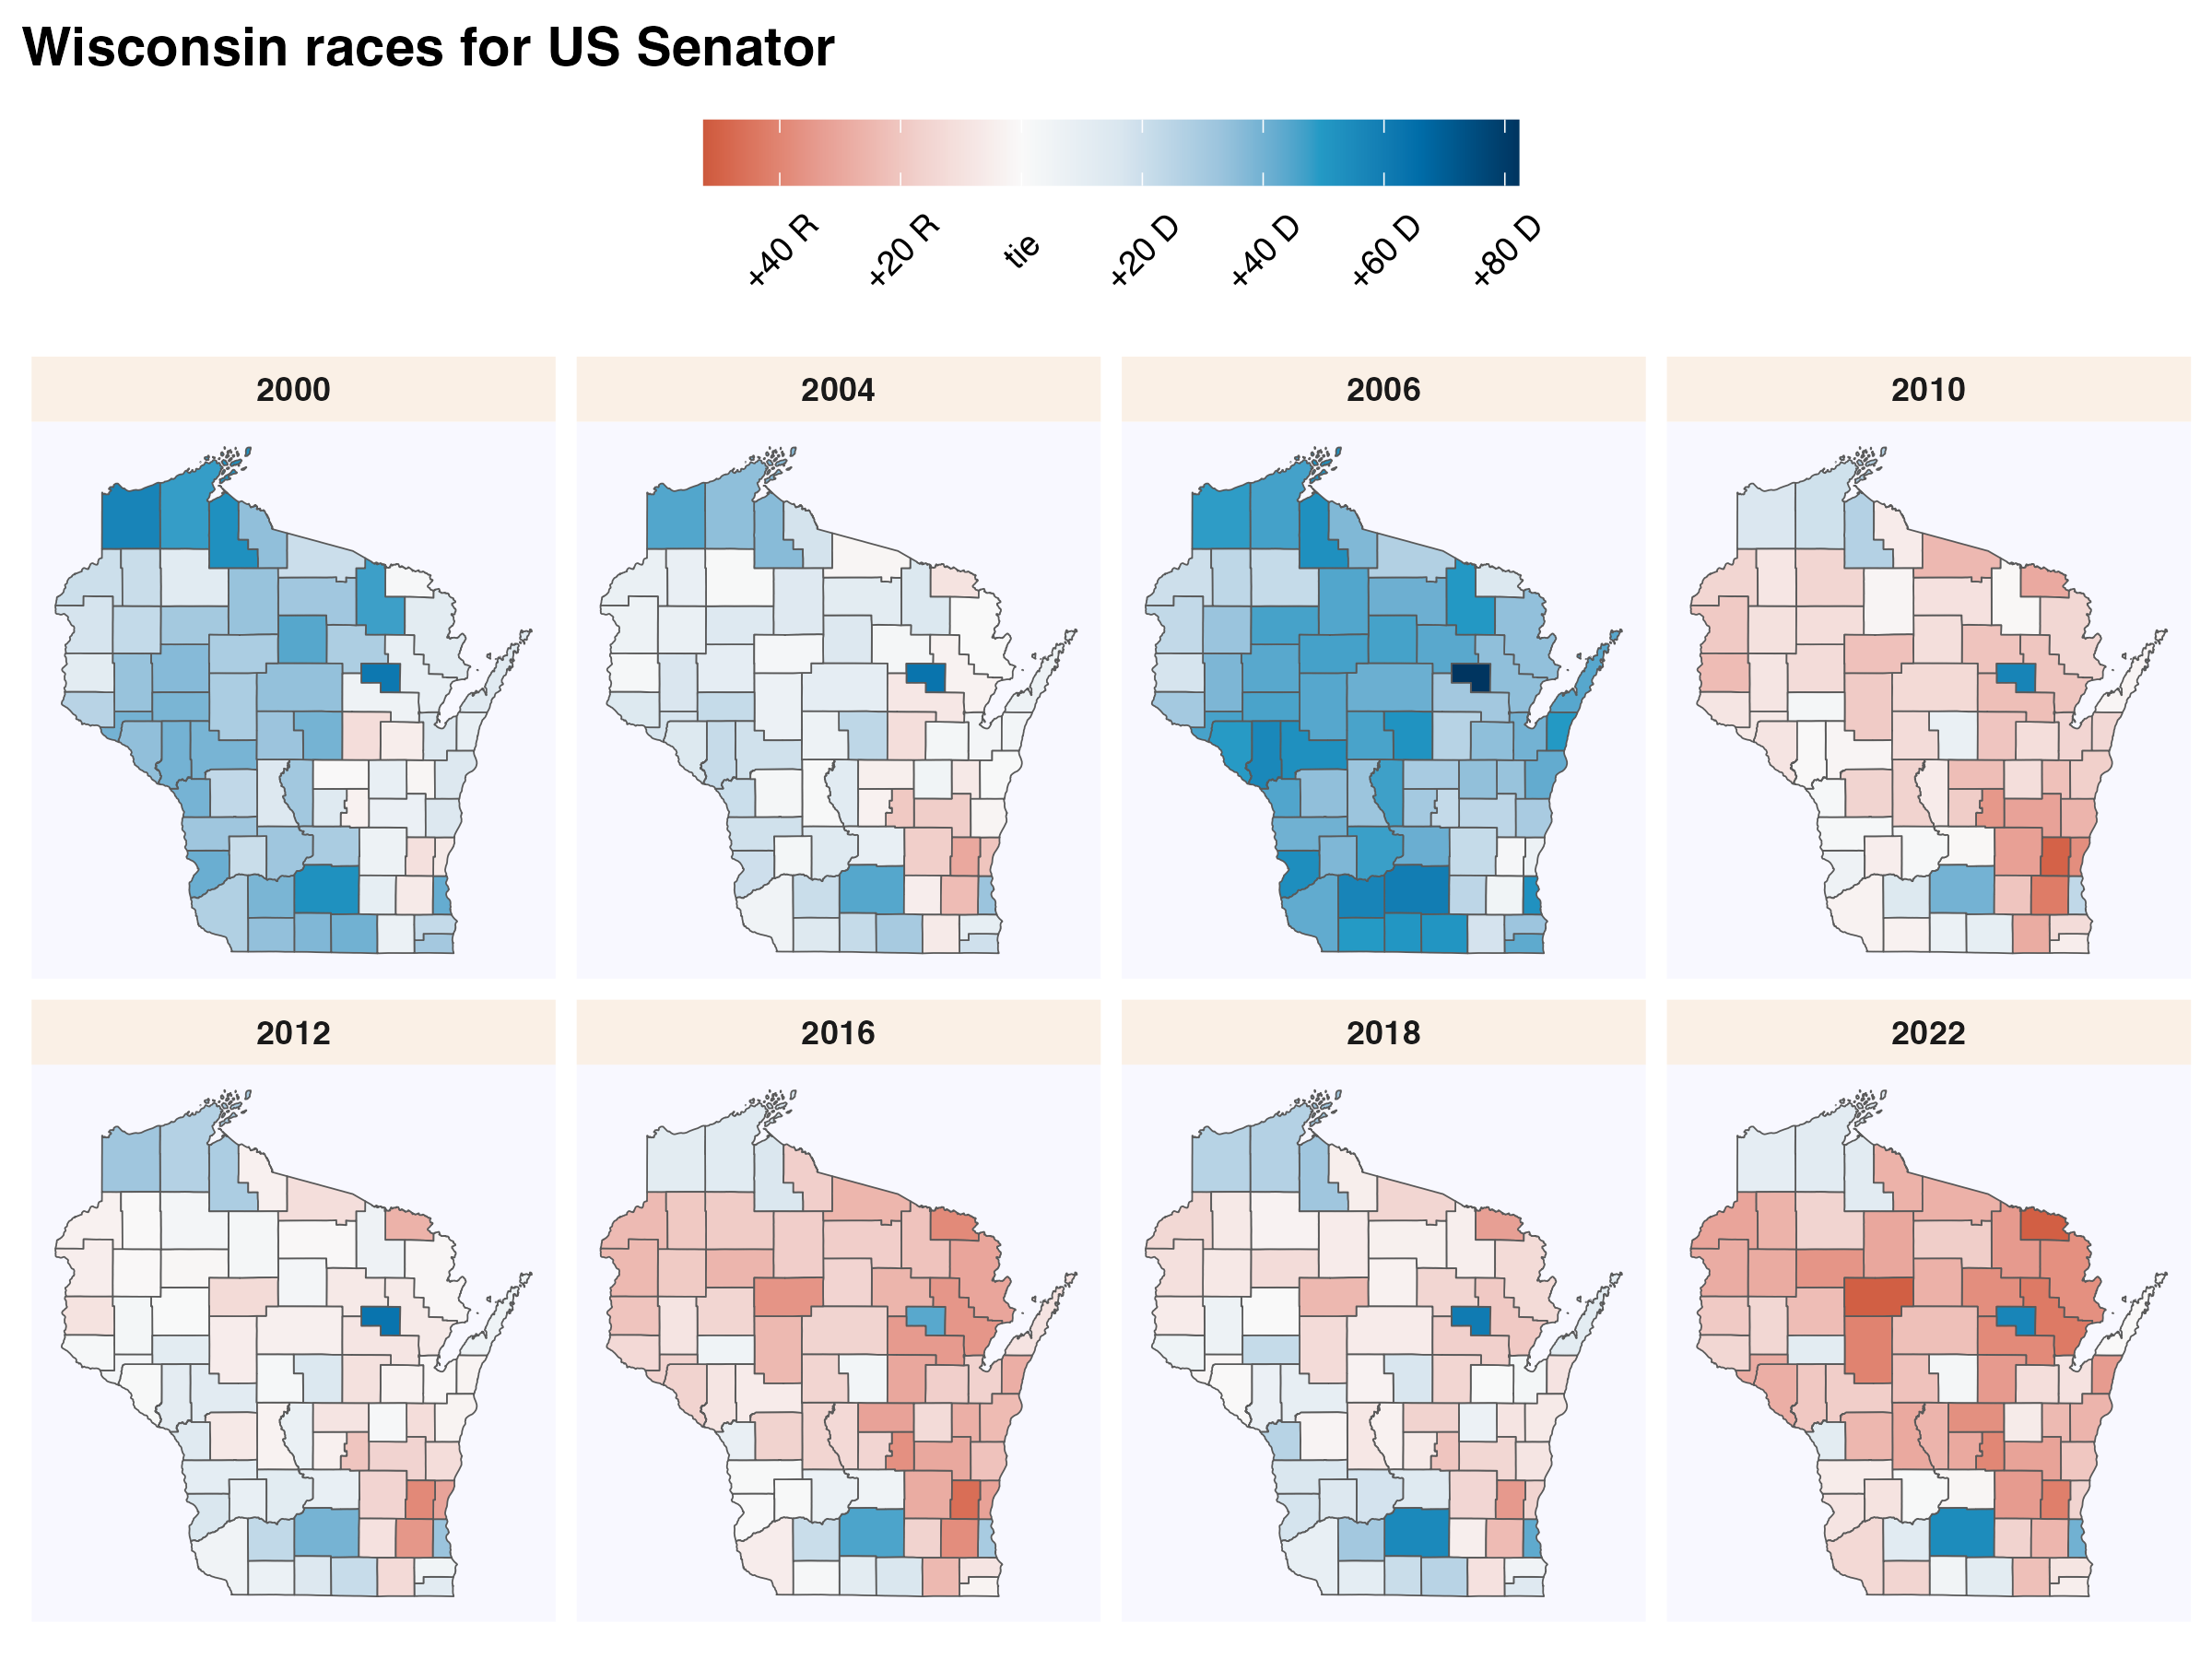
Since 2000, most counties have shifted toward the Republican Party across races for president, governor, and US Senate. Offsetting this geographically broad trend, many of the most populous counties have increased their support for Democratic candidates. This includes longtime Democratic strongholds like Madison and Milwaukee. But in recent years, it also includes inroads by the Democratic party into some of the suburban counties that made up the core of Republican support in the early 2000s.
The maps below show the result of each election for president, governor, or senator since 2000.
recent trends
These dot plots highlight trends in each county across the most recent races for president, governor, and senator. In most counties, Trump received more of the vote in 2024 than in 2016. In a few counties, his 2024 vote share was more than in 2020 but less than in 2016. And in just three counties–Waukesha, Ozaukee, Washington, and Door–Trump’s 2024 vote share declined from 2020.
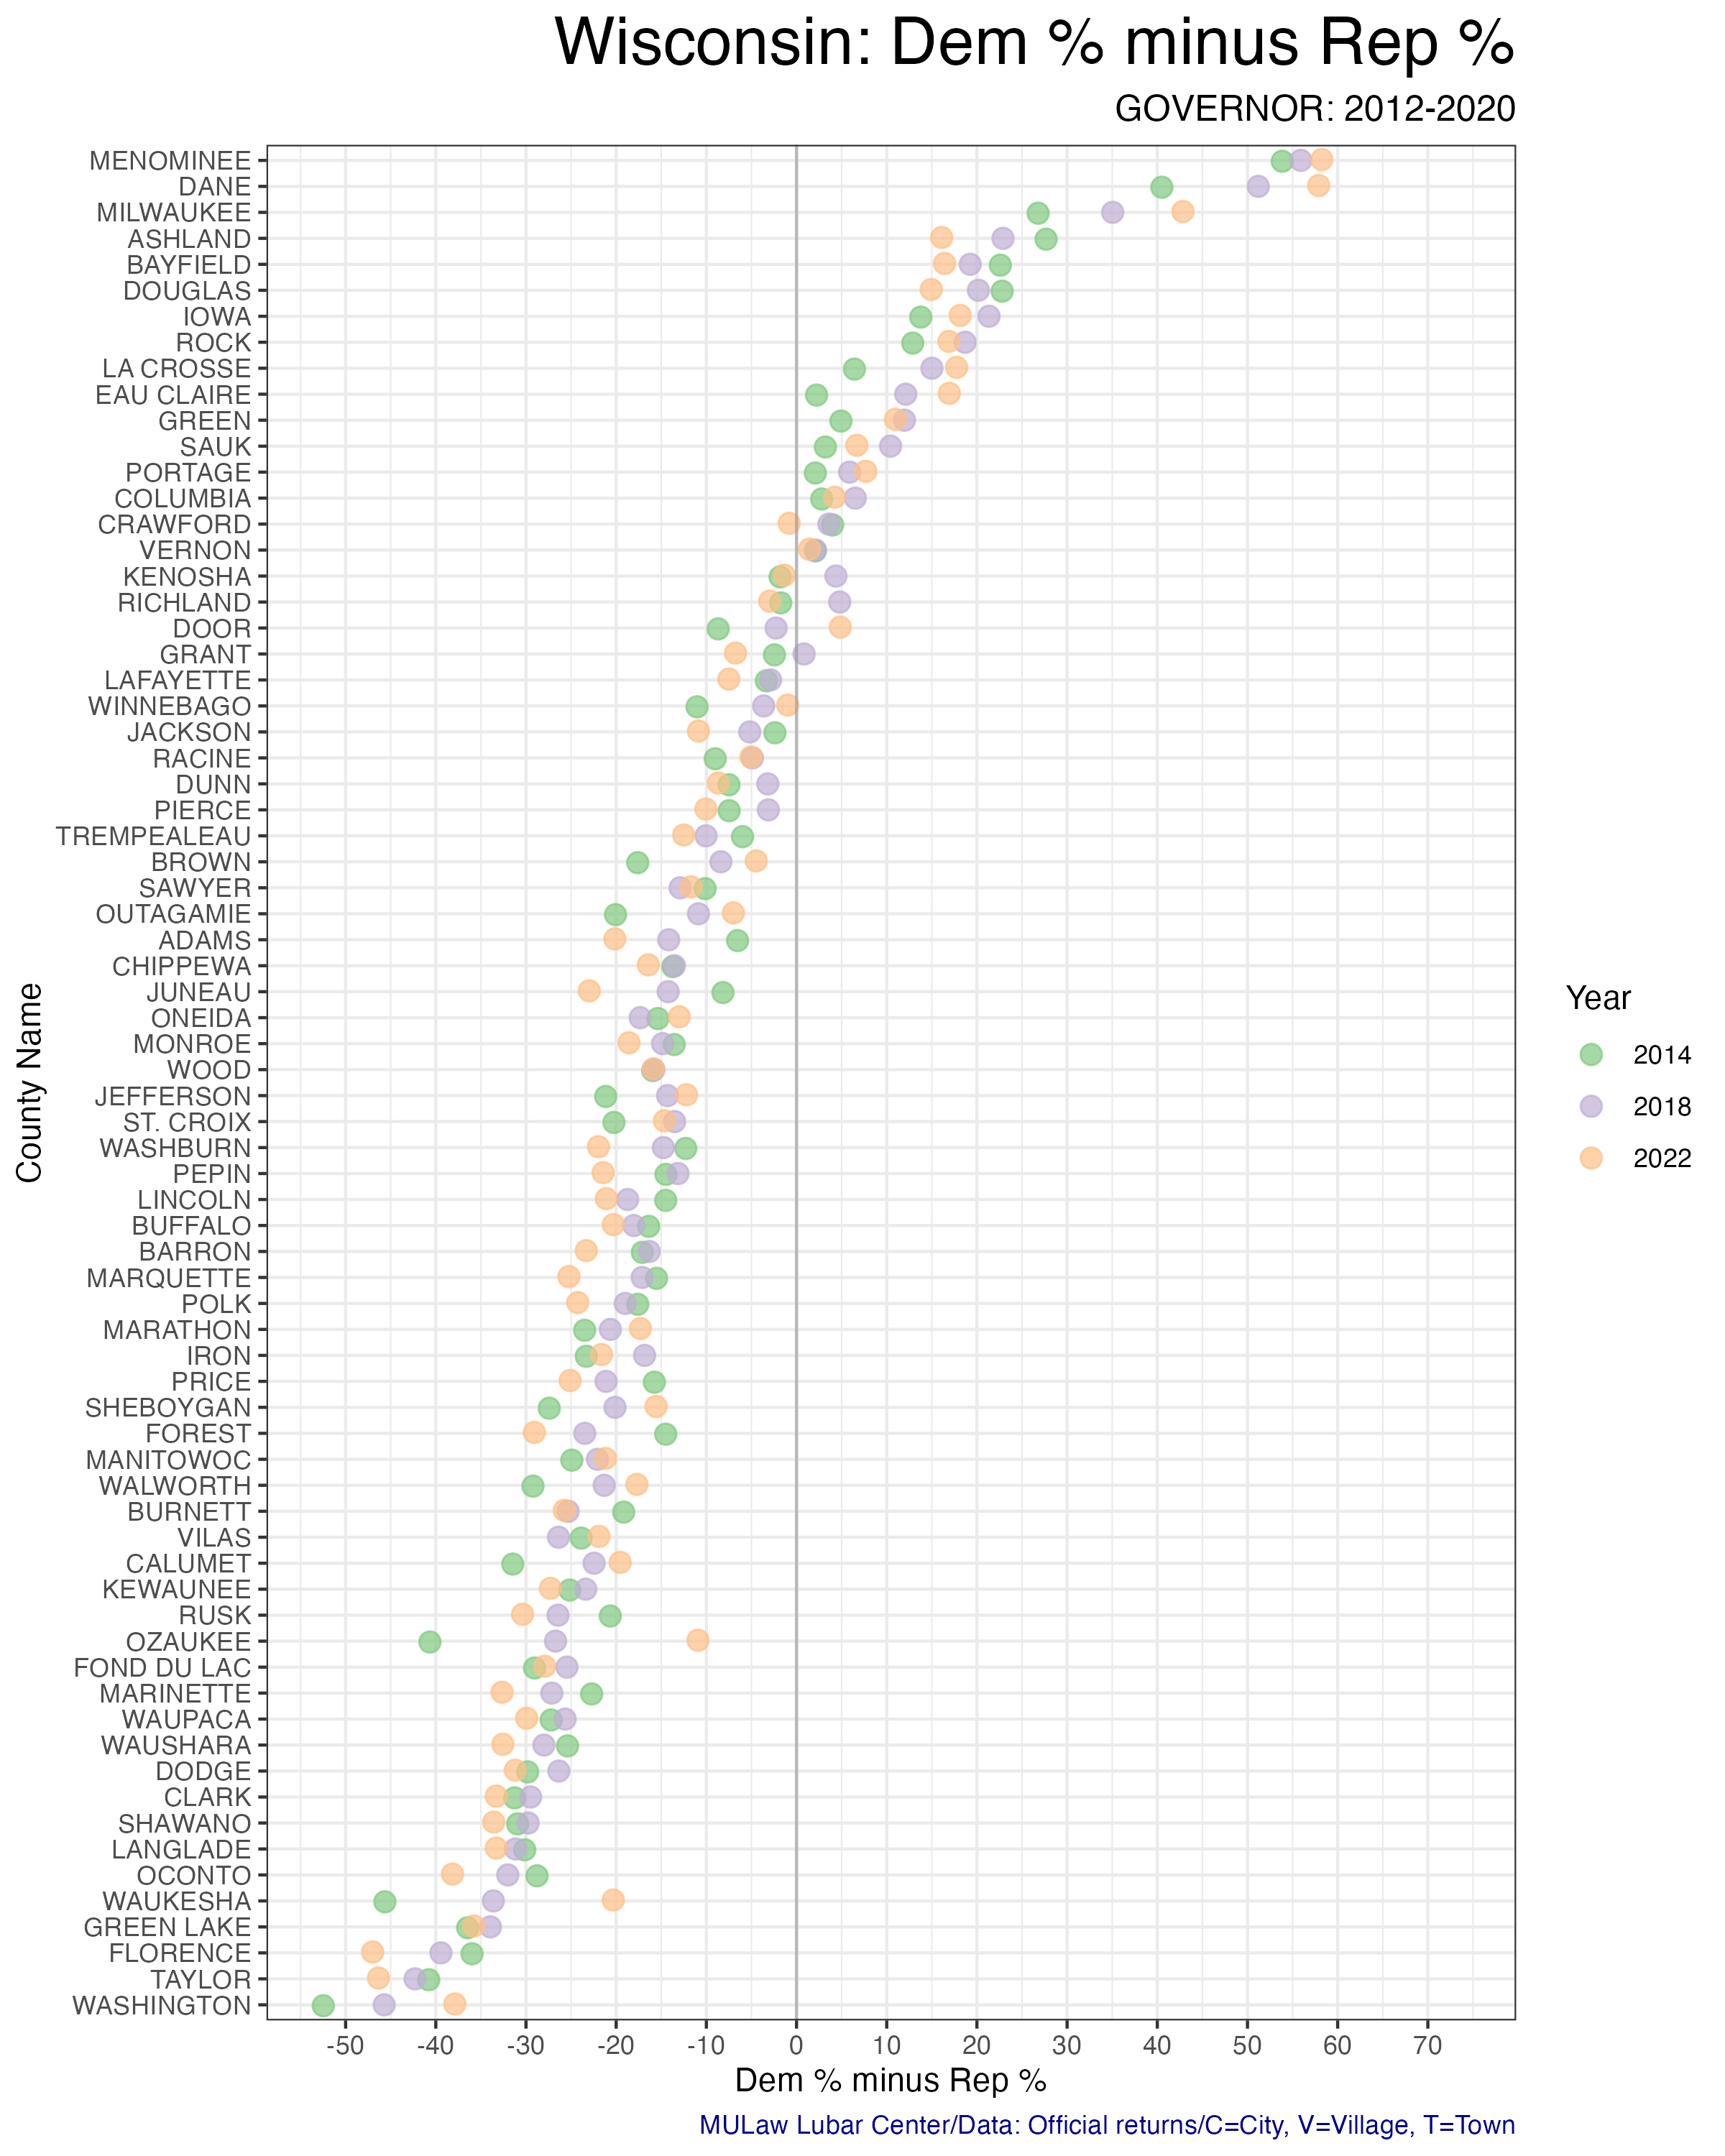
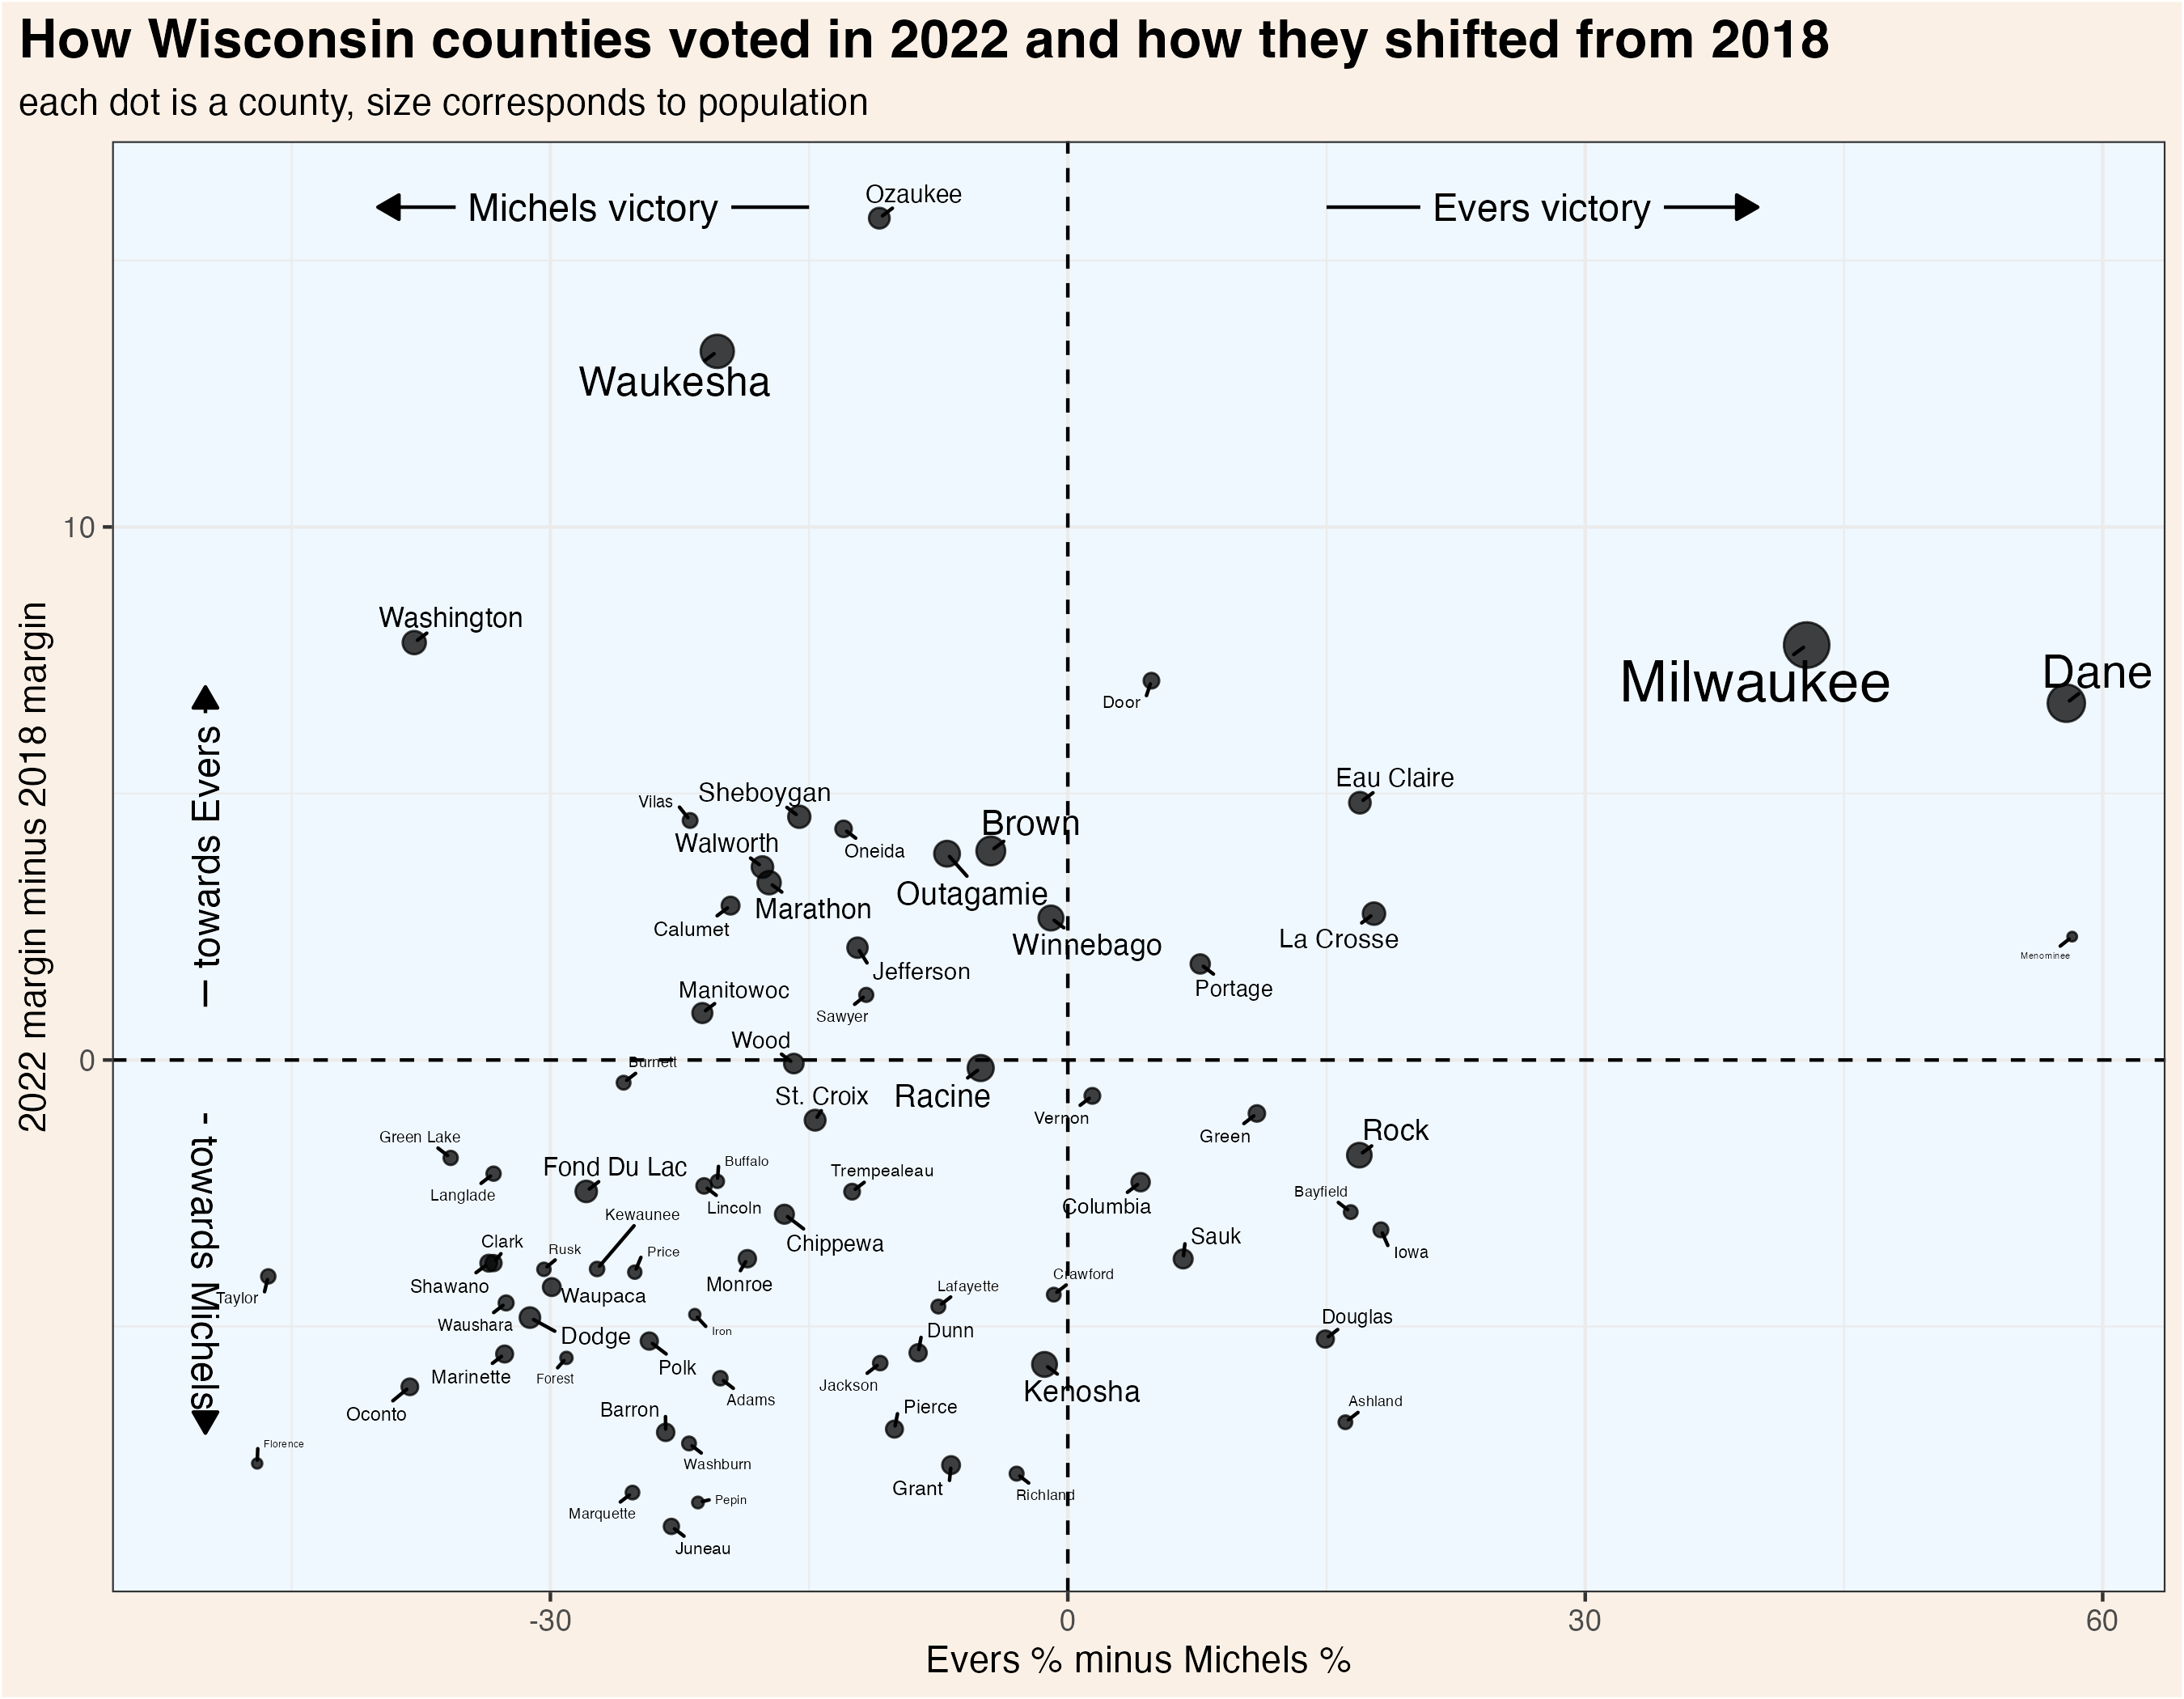
It is similarly instructive to compare the past three gubernatorial races. In some counties, even traditionally Democratic ones like Ashland and Douglas, the margins for Republican candidates have improved in consecutive elections. In other counties, including strongly Republican places like Ozaukee and Waukesha, the margins for Democrats have increased in consecutive cycles.
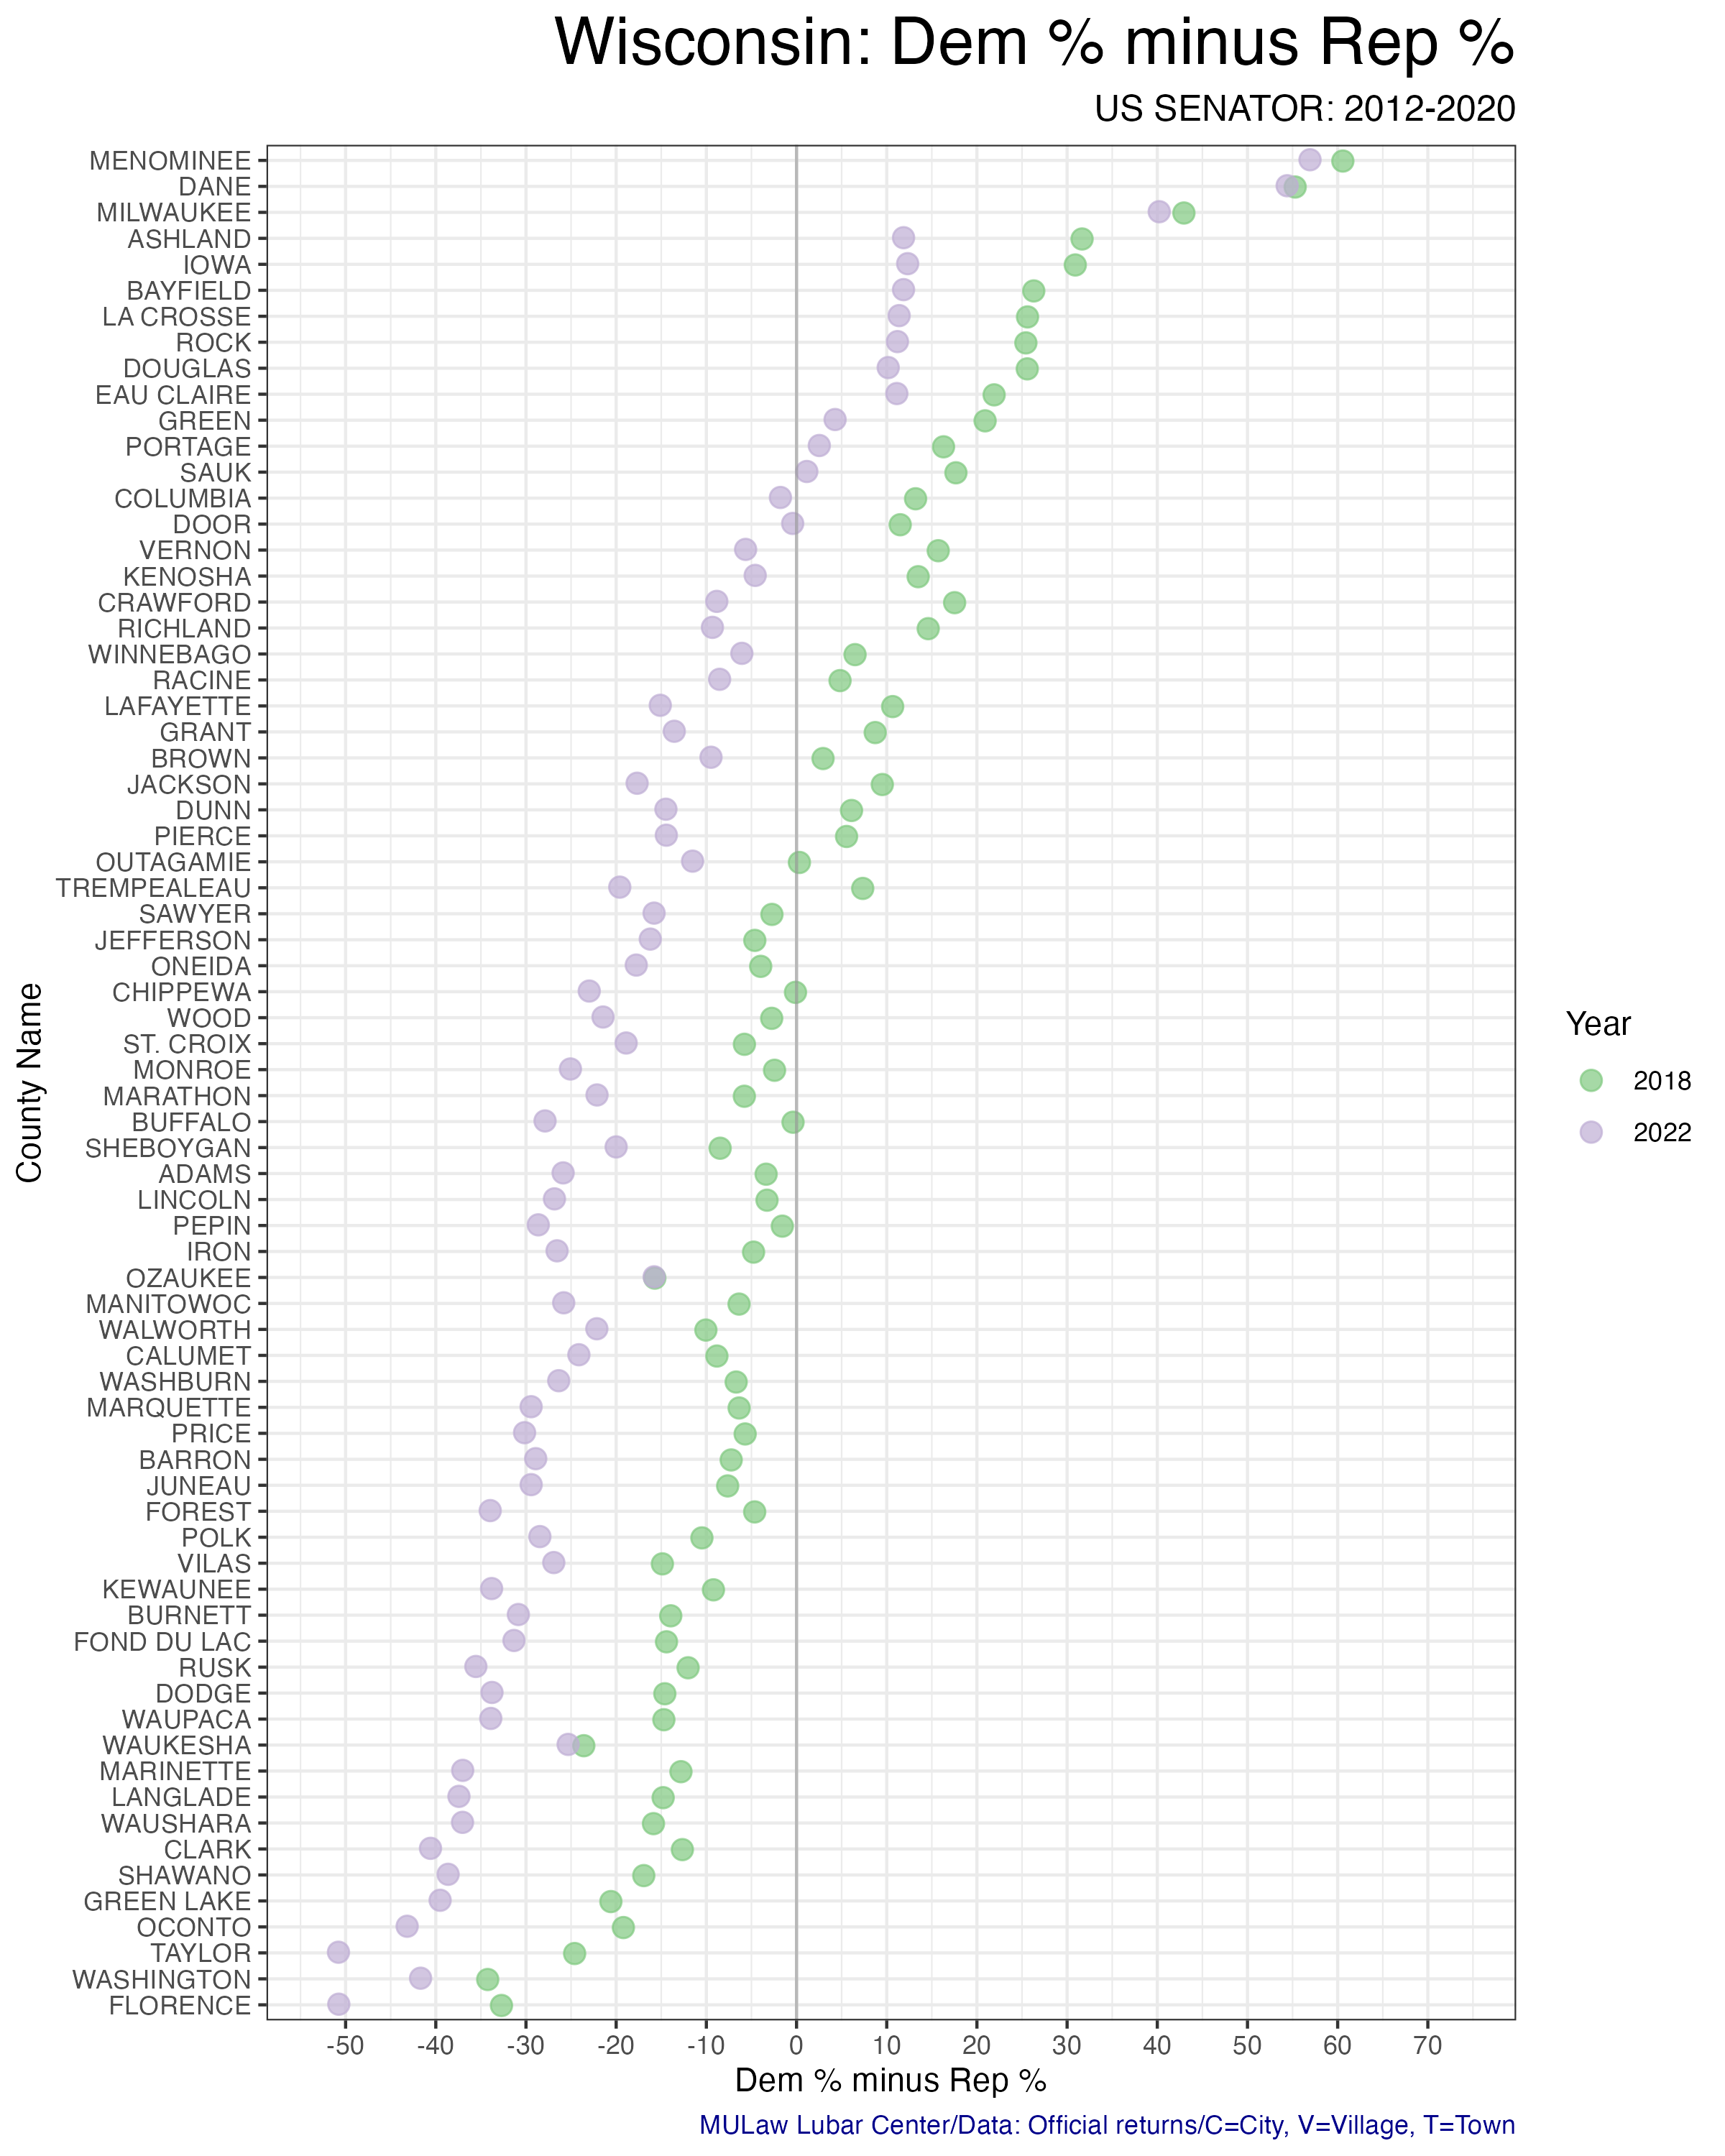
Democratic incumbent US Senator Tammy Baldwin enjoyed the largest margin of victory of any Democratic candidate in a decade in 2012. Four years later, Republican Senate incumbent Ron Johnson more narrowly won his reelection. Baldwin’s 2024 reelection was closer to the vote share of the losing Democratic candidate (Mandela Barnes) in 2022 than her own high water mark in 2018.
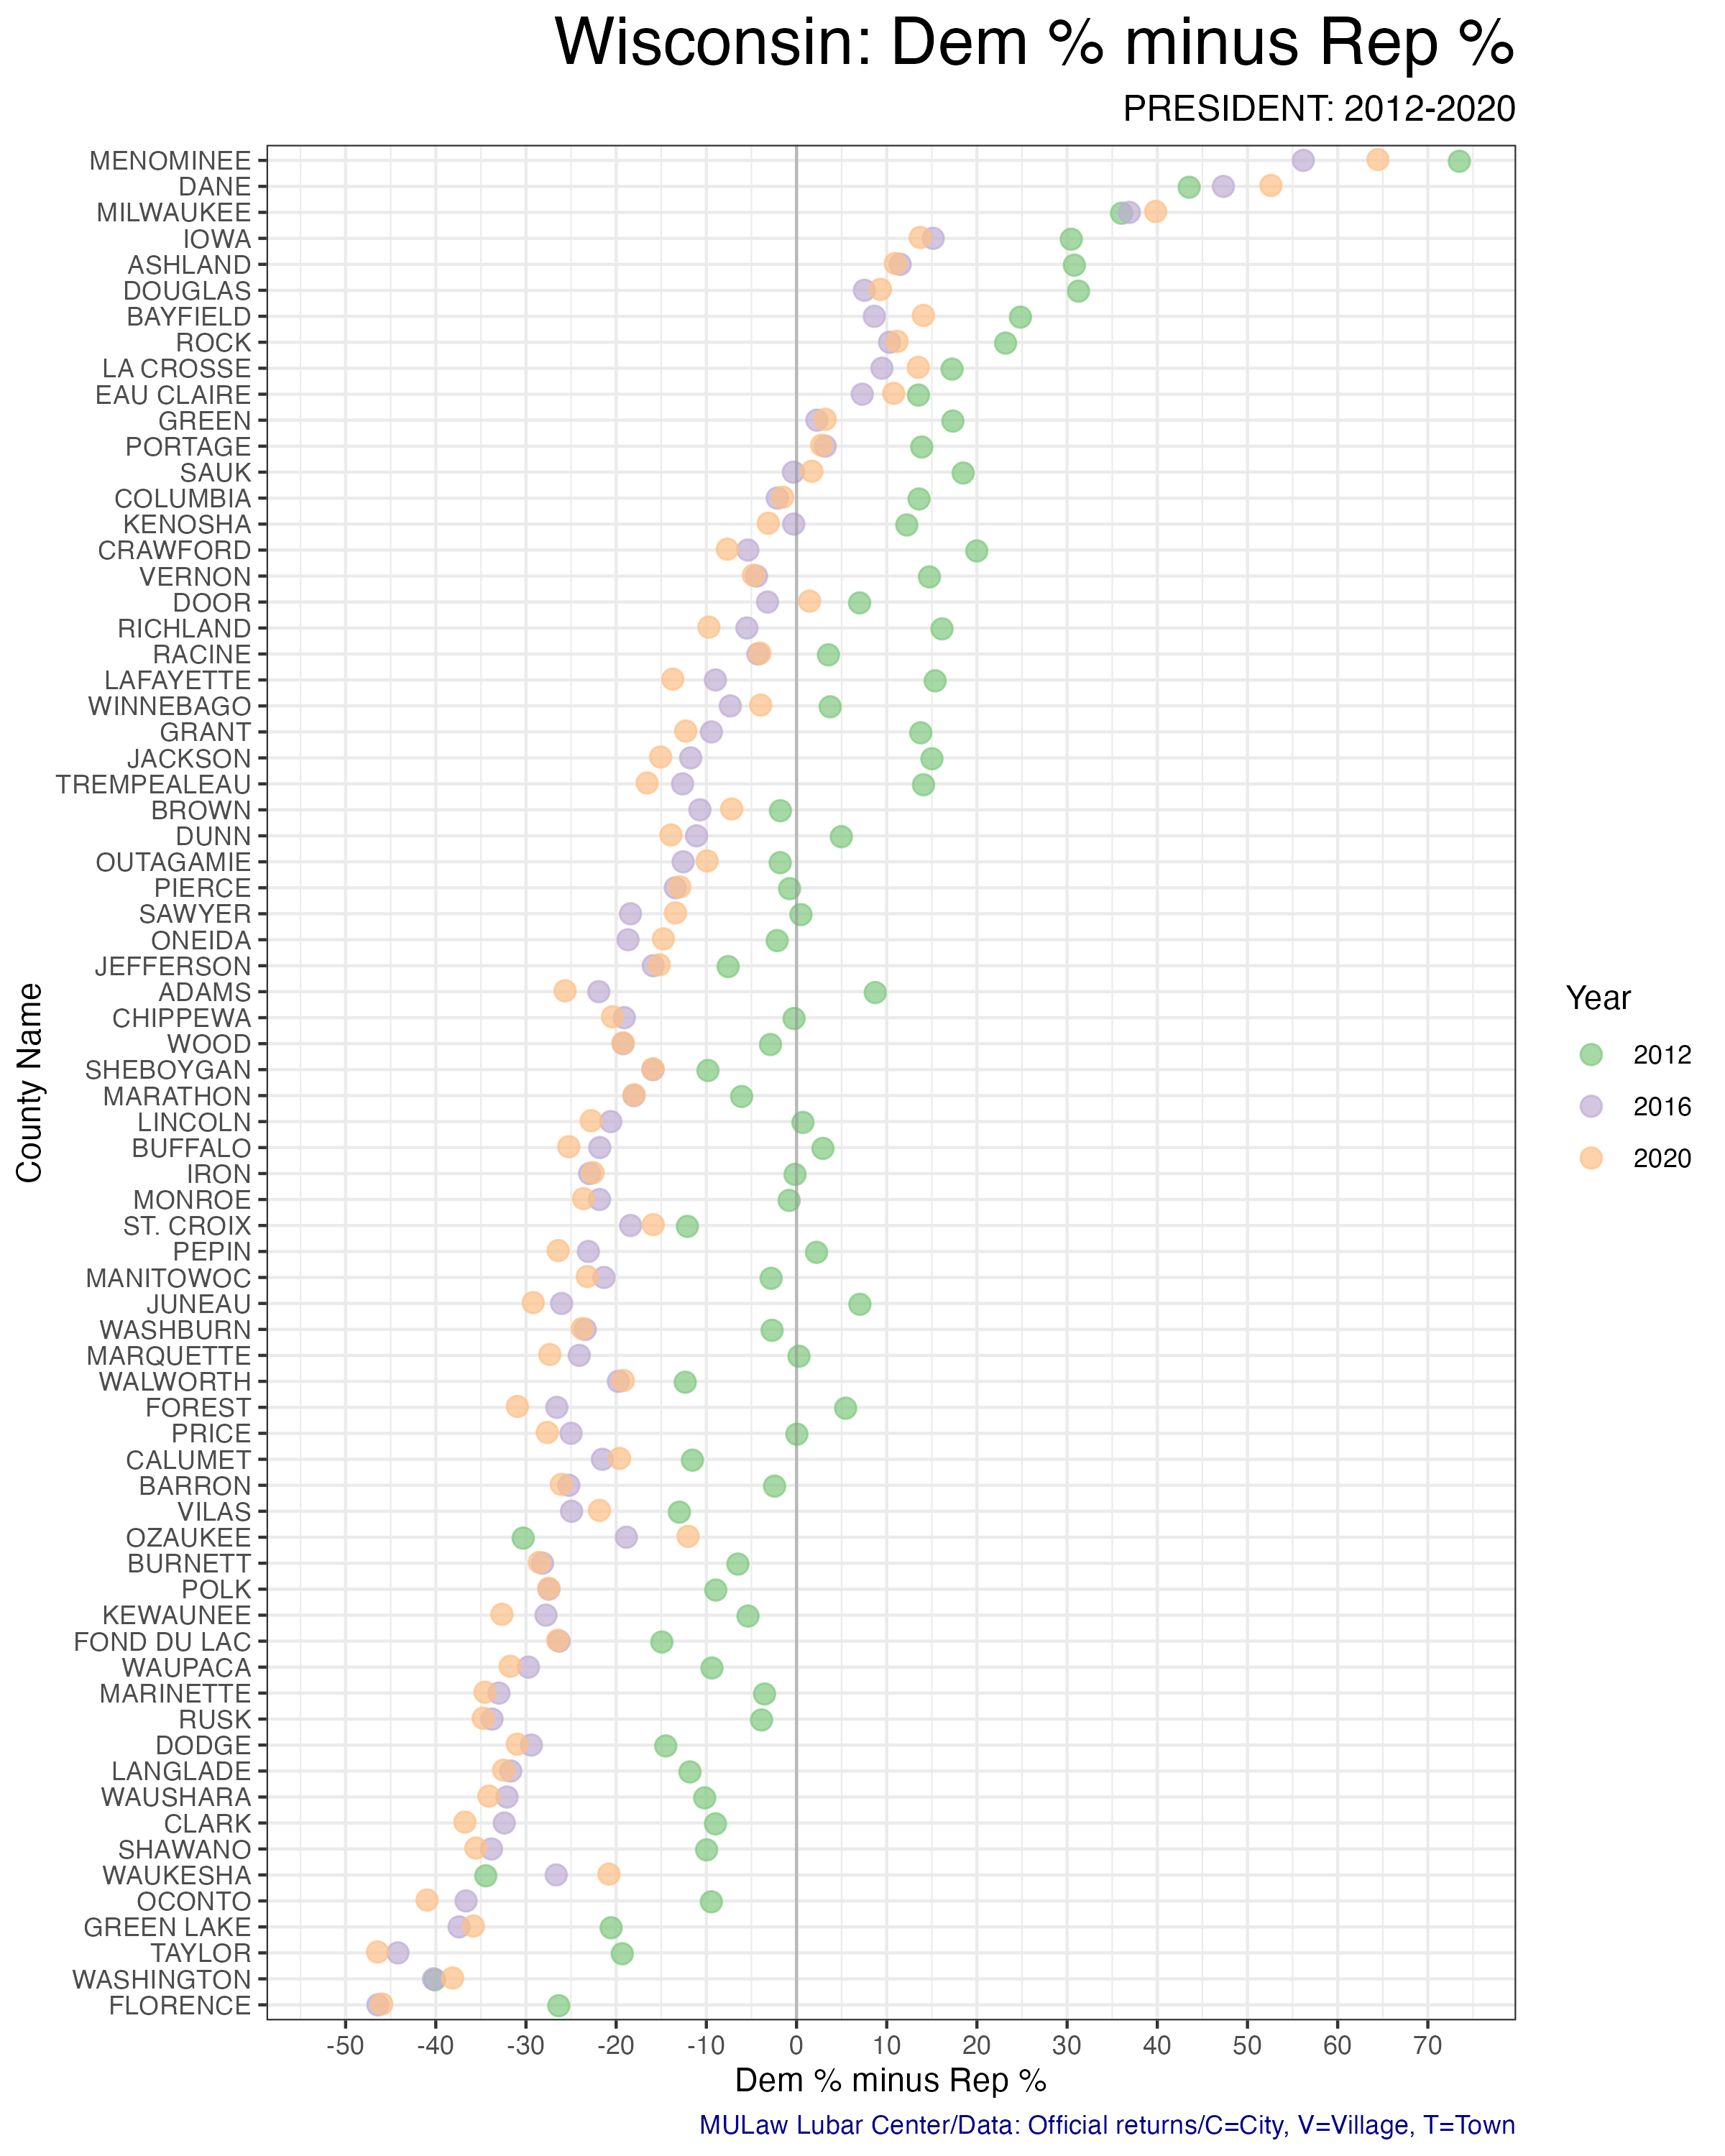
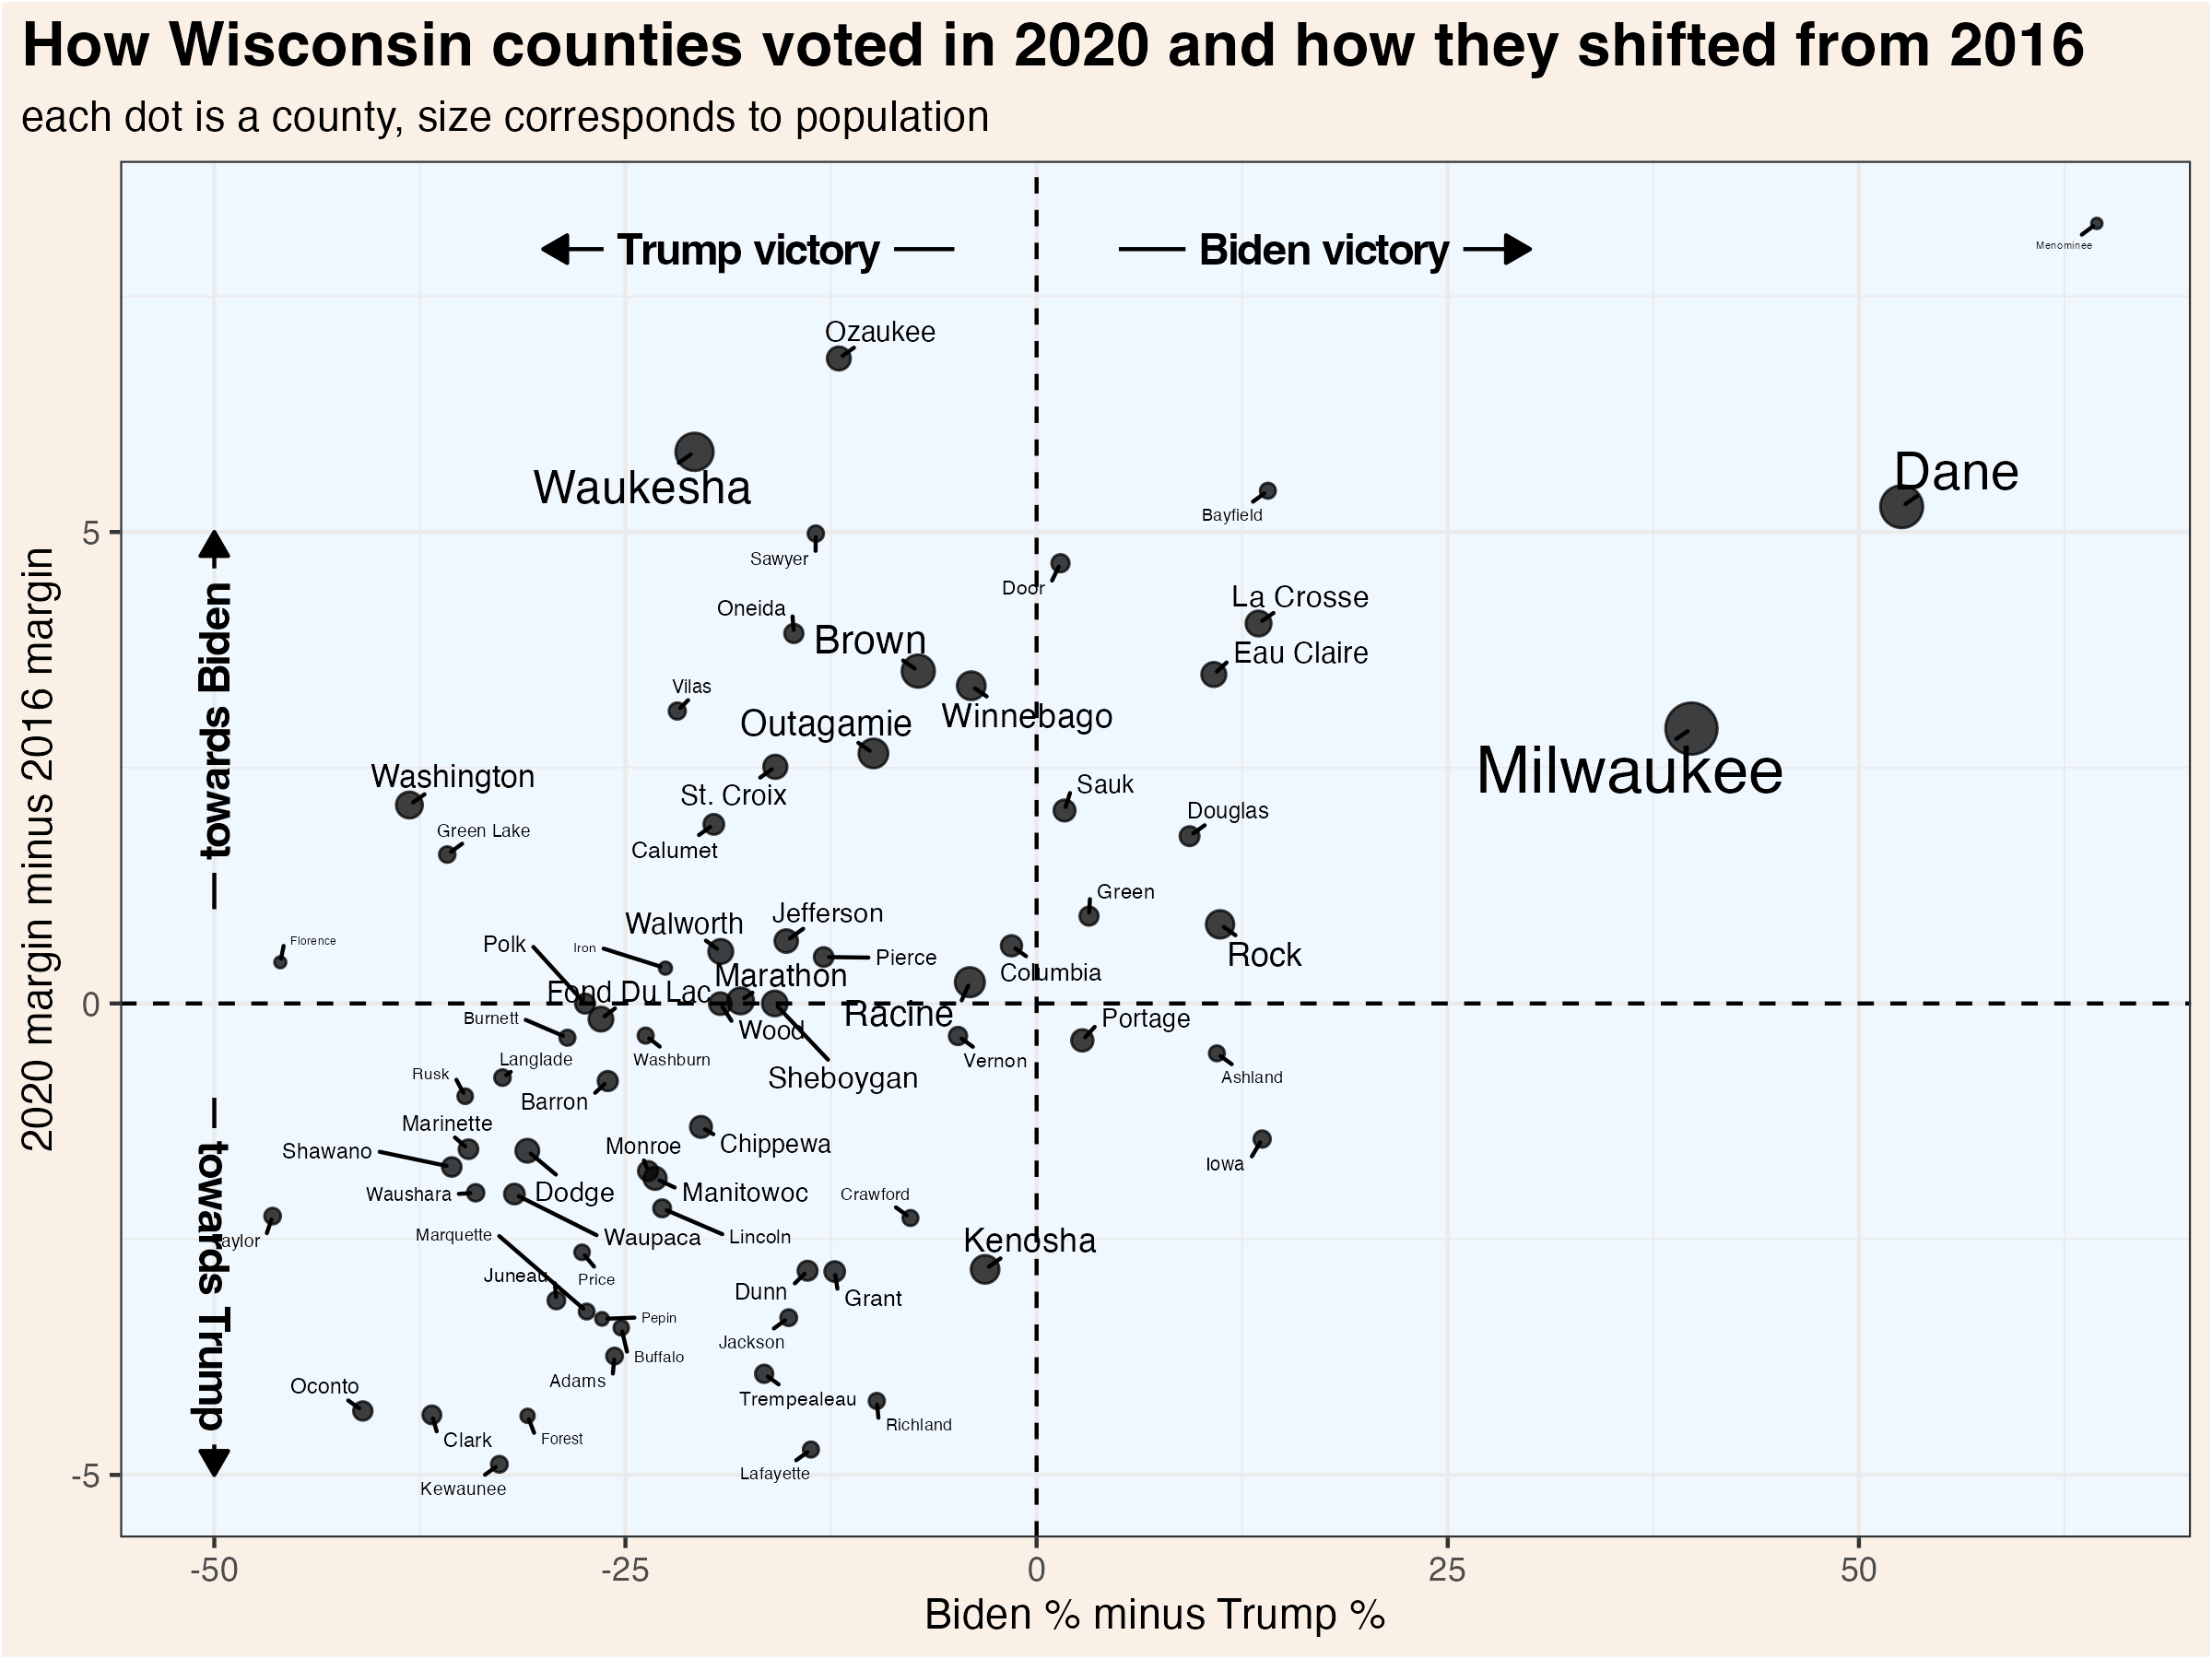
These scatterplots show some of the same information as the above dot plots, but they emphasize the change between elections.

election tables
These tables contain official election results within each county for races since 2000. The simple table shows one row per race and includes the vote margin. The detailed table shows one row per candidate and includes complete candidate names and votes, including for third parties.
Supreme Court elections
Wisconsin’s Supreme Court has 7 justices, each of whom are elected to 10 year terms in statewide elections held in April. State law prohibits more than one Supreme Court election from being held in a single year. If a seat becomes vacant, the governor appoints a replacement who serves until the next year in which no court election is already scheduled. If more than two candidates achieve ballot access, a nonpartisan, top-two primary is held in February.
Court elections are formally nonpartisan, but candidates are usually supported by either liberals or conservatives. In recent years, it has become common for the Democratic and Republican parties to endorse and actively campaign on behalf of favored judicial candidates. The liberal and conservative labels indicated in the following graphs and tables are based on widely recognized tendencies, not any formal affiliation.
The graphic below visualizes the results of the past three Supreme Court elections in each county. The tables contain complete results for all races since 2000.
