15 Dane
Dane County (pop. 565,000) is home to Wisconsin’s state capitol, flagship state university, and lion’s share of recent population growth. Not only did the county’s population grow by 32% from 2000 to 2020, the net number of votes cast for the Democratic presidential candidate grew by 173% over the same period. The racial makeup of Dane County’s population is similar to the rest of the state, but Dane is unusually highly educated. Fifty-five percent of adults over 24 have at least a bachelor’s degree and 22% have an advanced degree.
15.1 Demographics

15.2 County Election Results

Click each column name to sort its values.
15.3 Municipality Election Results
The City of Madison, a Democratic stronghold, contains about half the county’s population. Almost all the communities surrounding the City of Madison are also Democratic. In fact, Madison is not even the most Democratic community of the bunch (that distinction belongs to the Village of Shorewood Hills). Only a few more rural communities lean Republican.
This map shows the location of each municipality in the county, as it existed in 2022.

These dot plots show the most recent election results in each municipality.


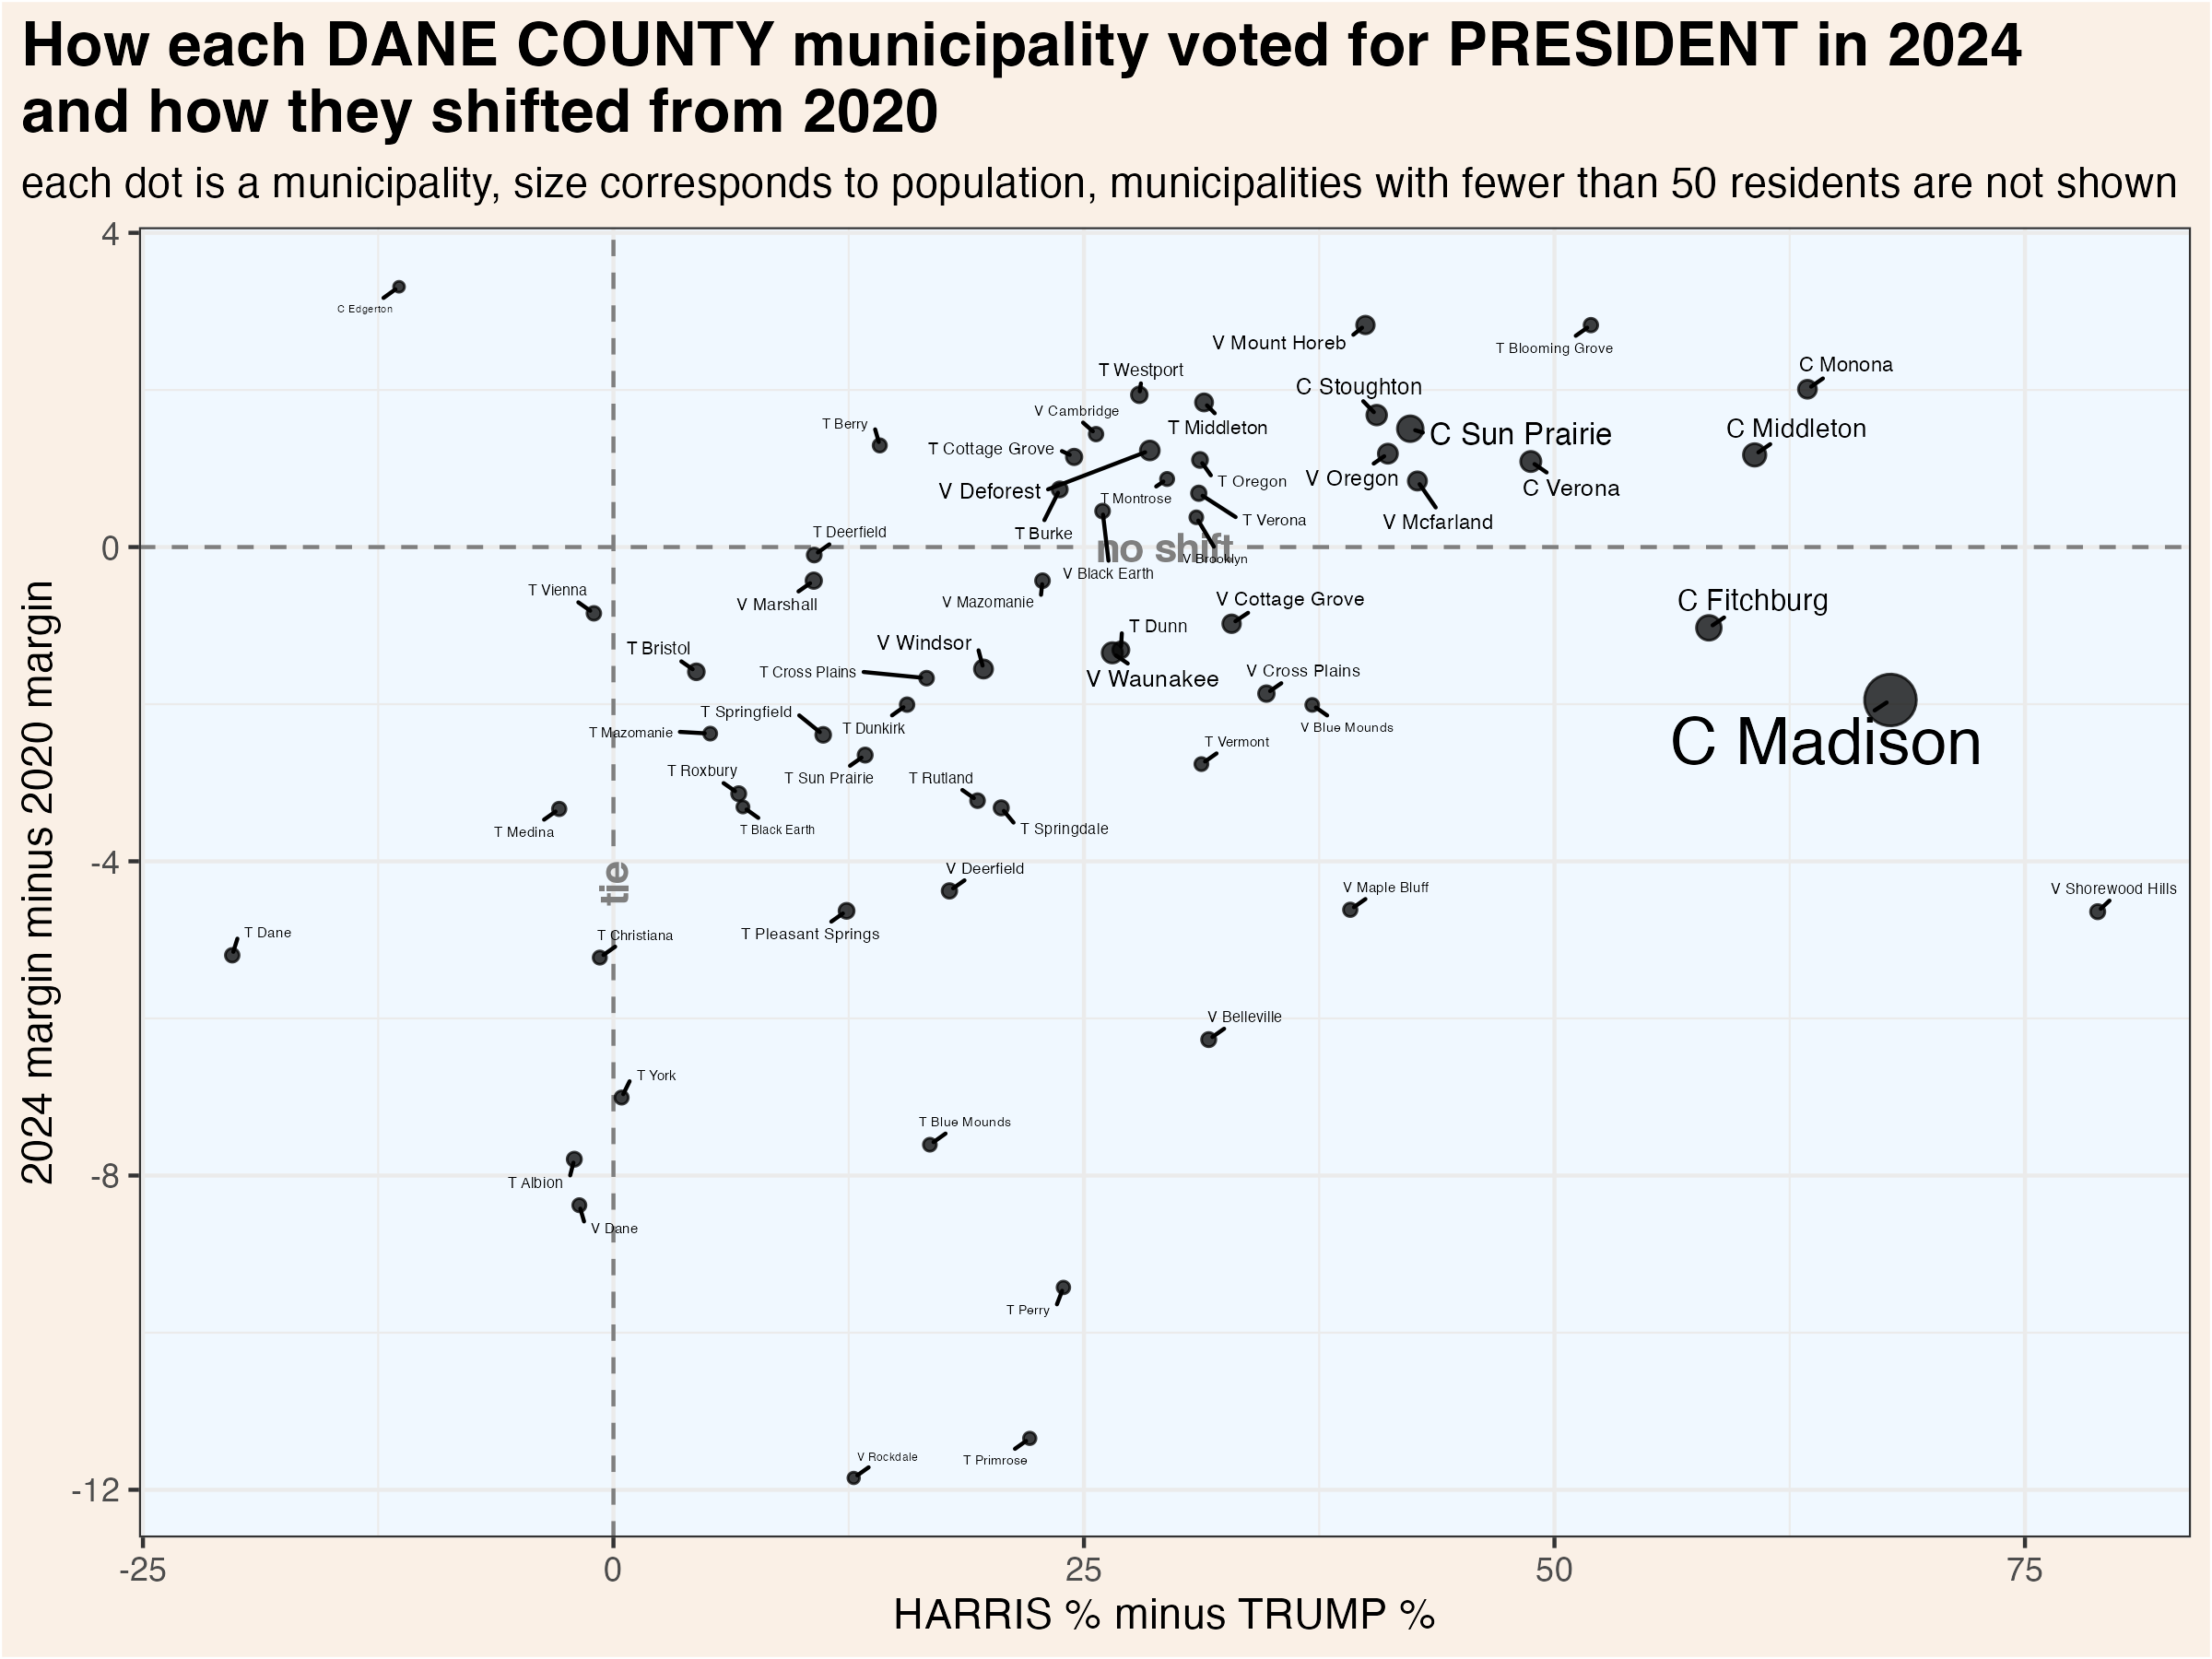
To more clearly illustrate recent changes in municipality voting trends, these scatterplots compare the most recent vote for president and senator with the shift from that office’s previous election.

These maps show show every election result since 2000 in each municipality.


Click each column name to sort its values.
15.4 Supreme Court Election Results
Wisconsin’s Supreme Court has 7 justices, each of whom are elected to 10 year terms in statewide elections held in April. State law prohibits more than one Supreme Court election from being held in a single year. If a seat becomes vacant, the governor appoints a replacement who serves until the next year in which no court election is already scheduled. If more than two candidates achieve ballot access, a nonpartisan, top-two primary is held in February.
Court elections are formally nonpartisan, but candidates are usually supported by either liberals or conservatives. In recent years, it has become common for the Democratic and Republican parties to endorse and actively campaign on behalf of favored judicial candidates. The liberal and conservative labels indicated in the following graphs and tables are based on widely recognized tendencies, not any formal affiliation.
15.4.1 County Election Results
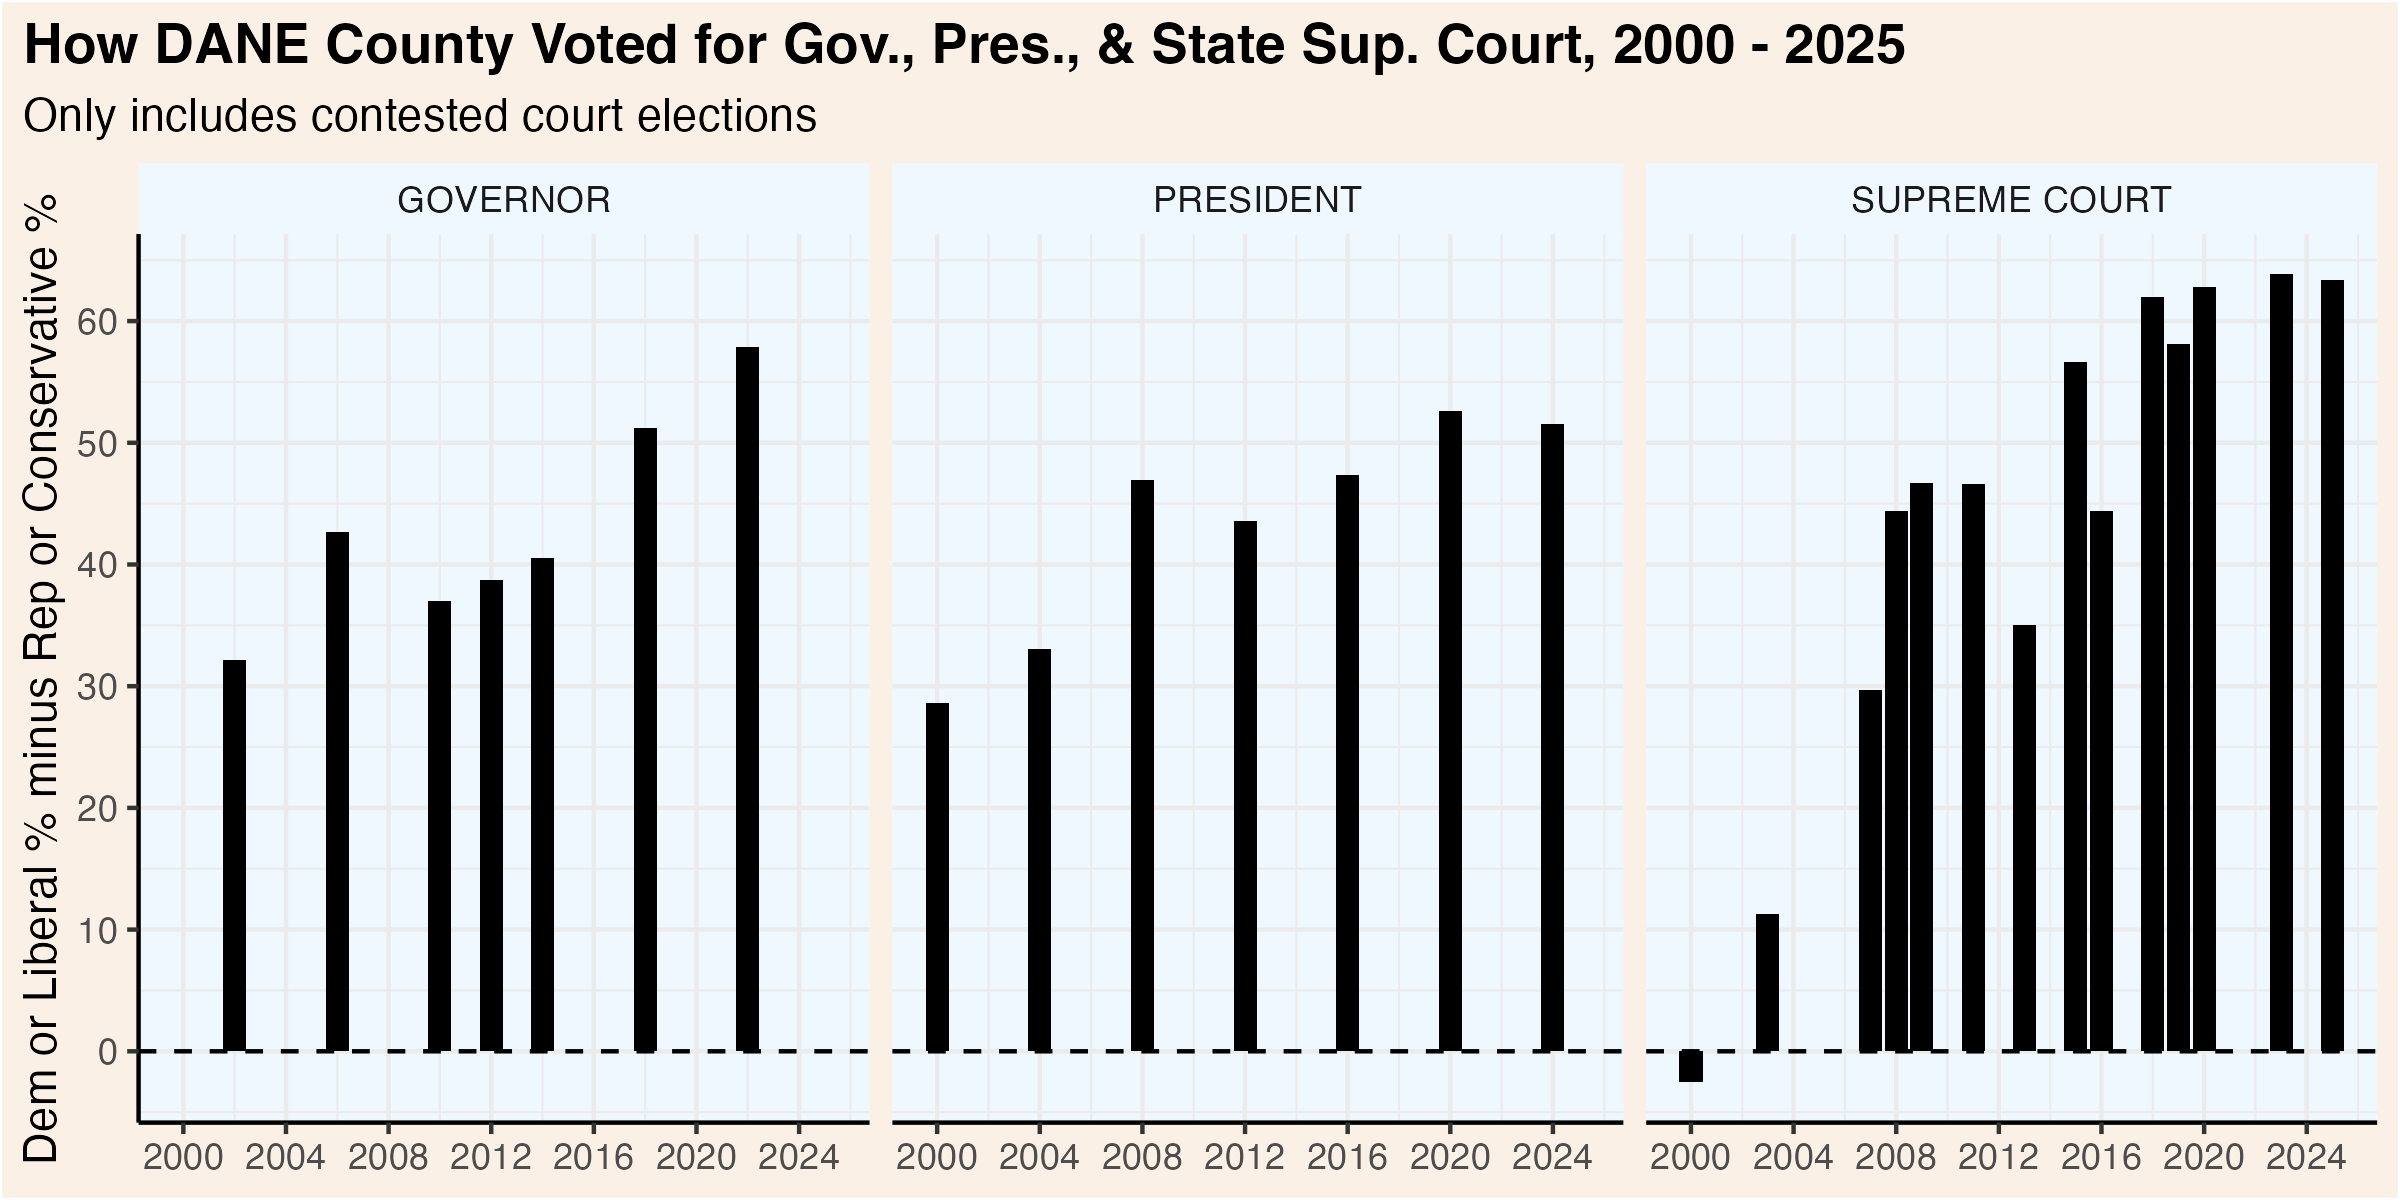
This graphic compares how presidential, gubernatorial, and court elections have trended over the past quarter century. Click the “Table” tab to see detailed results for the Supreme Court races.
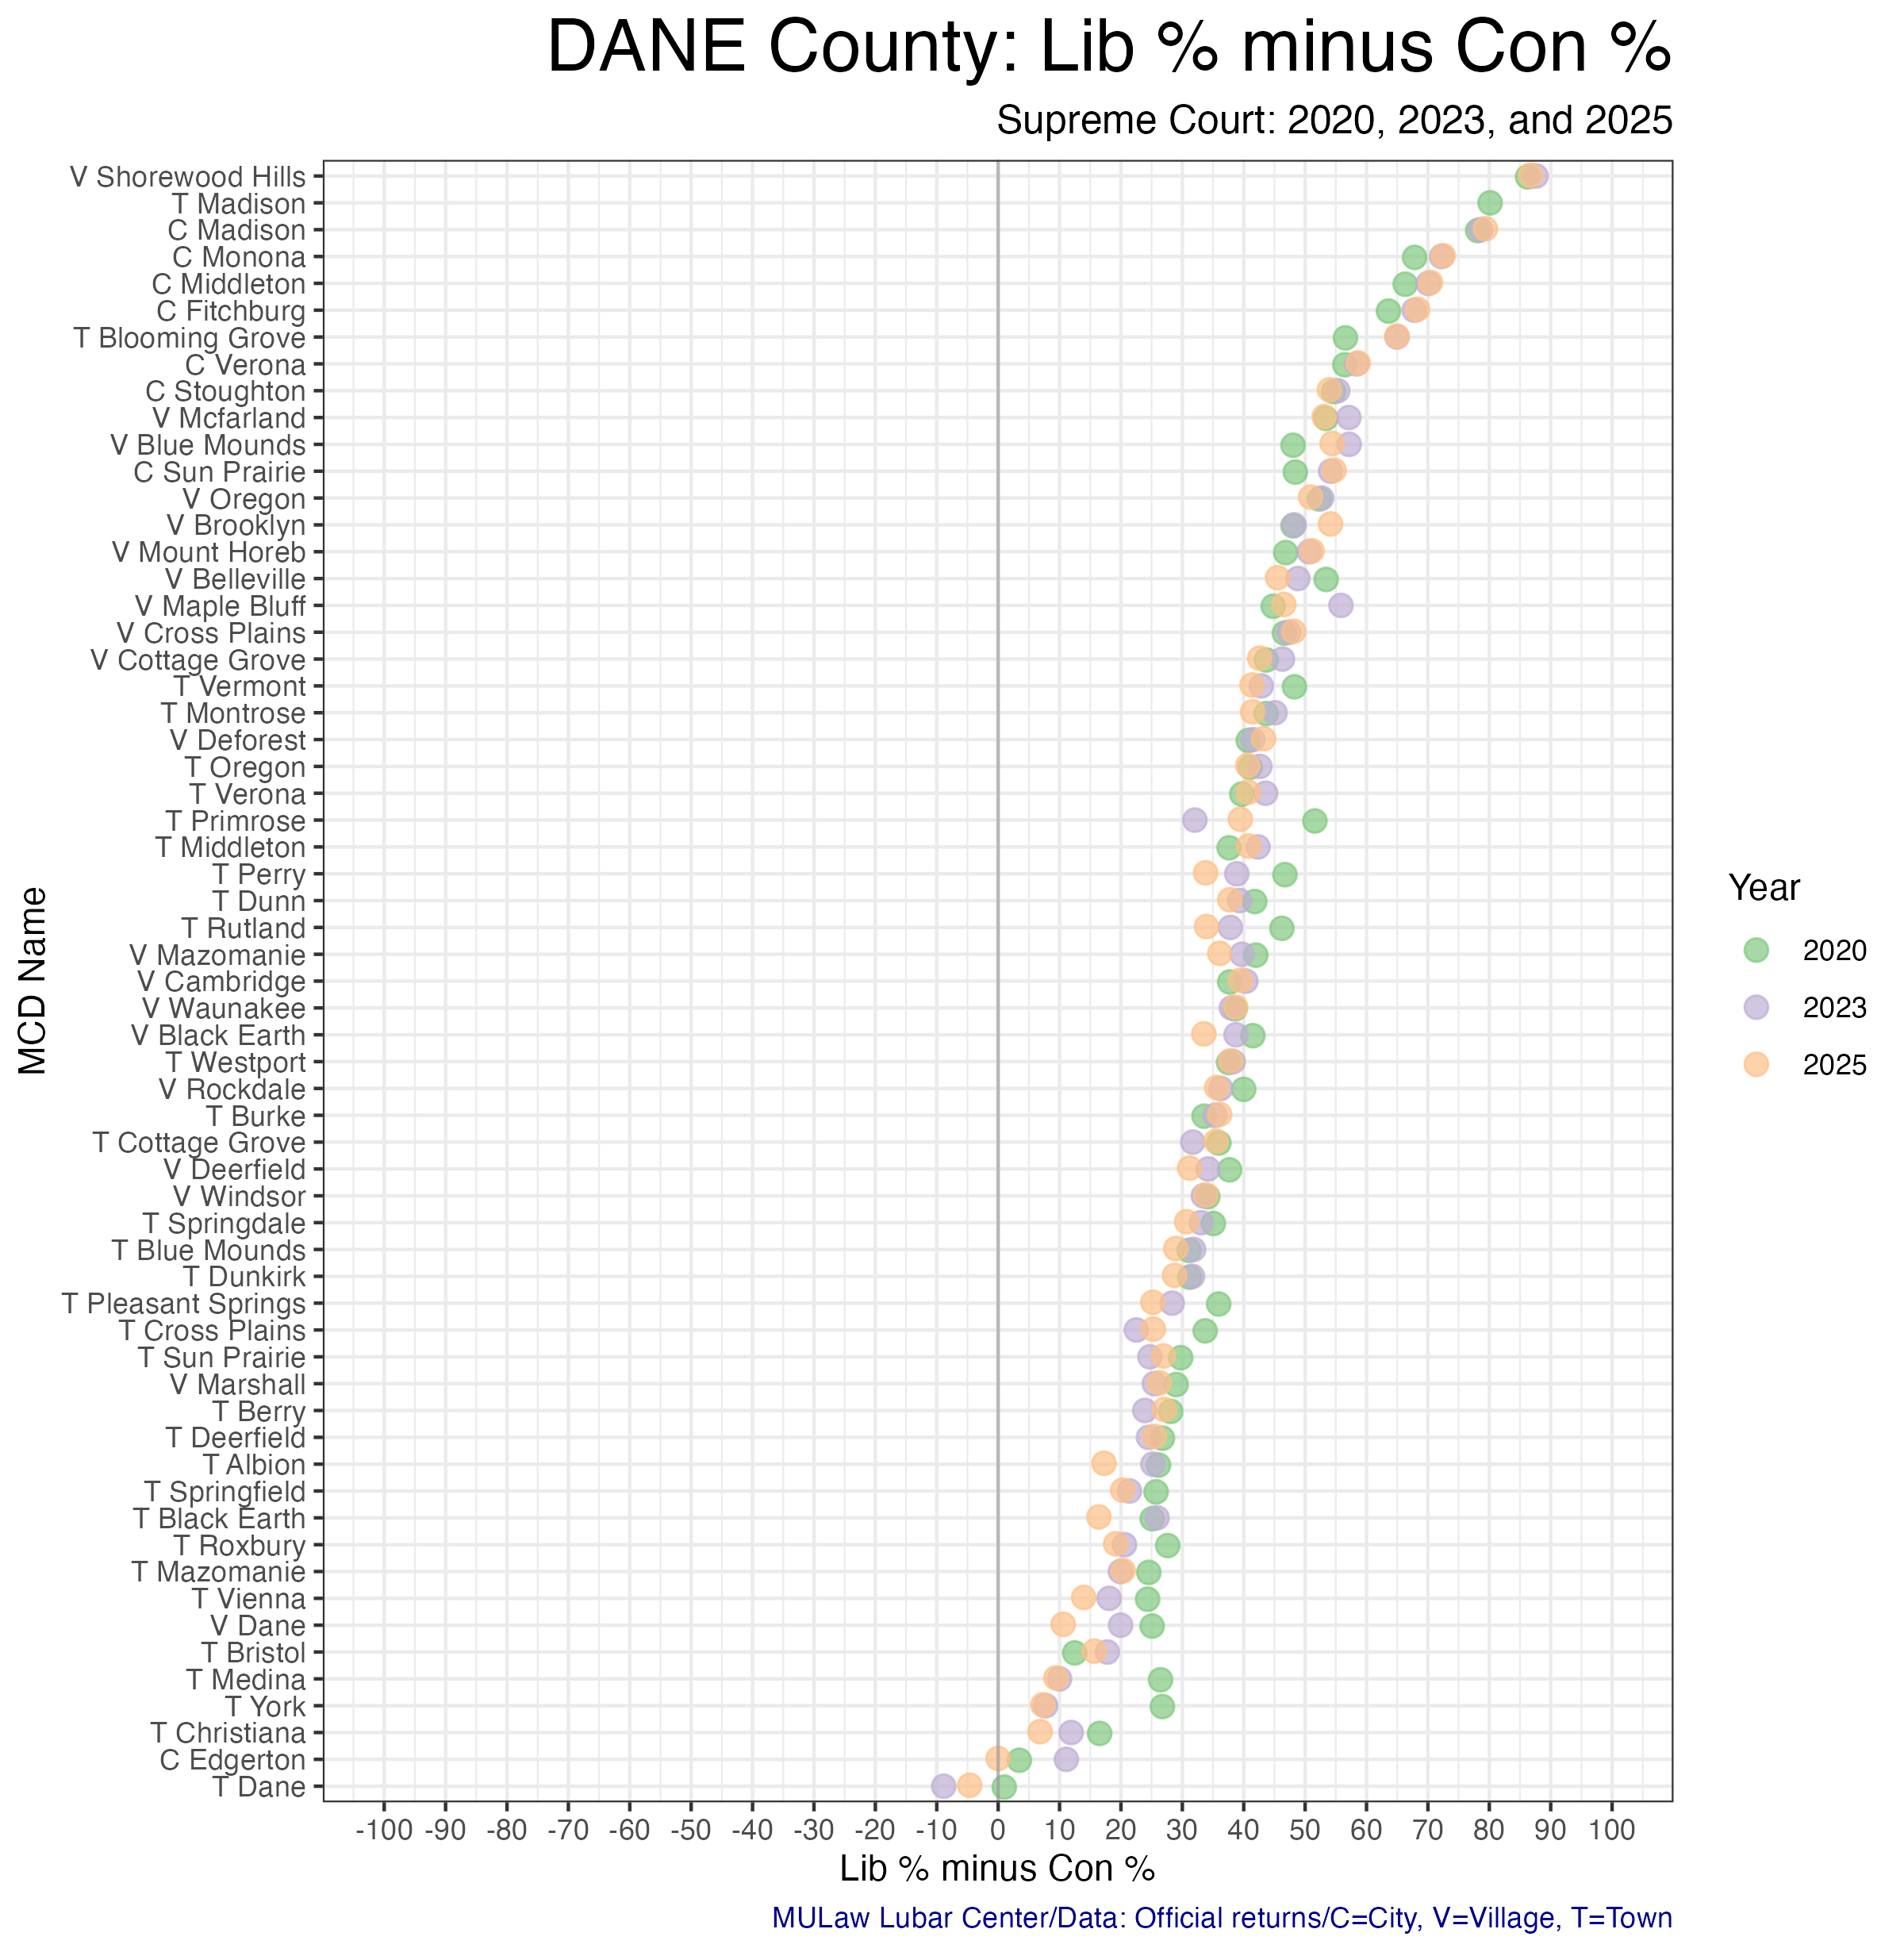
15.4.2 Municipality Election Results
The following table shows the results of each Supreme Court election by municipality. The graphic visualizes the shifts over the past three court elections.