20 Eau Claire
Located about 90 miles west of the Twin Cities, Eau Claire County is one of the fastest growing parts of Wisconsin outside of the Madison metro. The county’s population is more white than the state average, as well as younger and with generally higher levesl of educational attainment. Incomes are similar to the state average. Politically, Eau Claire leans Democratic. It was more competitive between the parties during the 2010-2016 period, but Democrats improved their performance in the 2018-2022 cycles.
20.1 Demographics

20.2 County Election Results

Click each column name to sort its values.
20.3 Municipality Election Results
Over half the population lives in the City of Eau Claire, home to UW-Eau Claire. Nearly 10,000 more live in the adjacent City of Altoona, the county’s second largest community. These two cities vote consistently Democratic and are responsible for the county’s overall tilt, as most of the rural towns vote Republican.
This map shows the location of each municipality in the county, as it existed in 2022.

These dot plots show the most recent election results in each municipality.


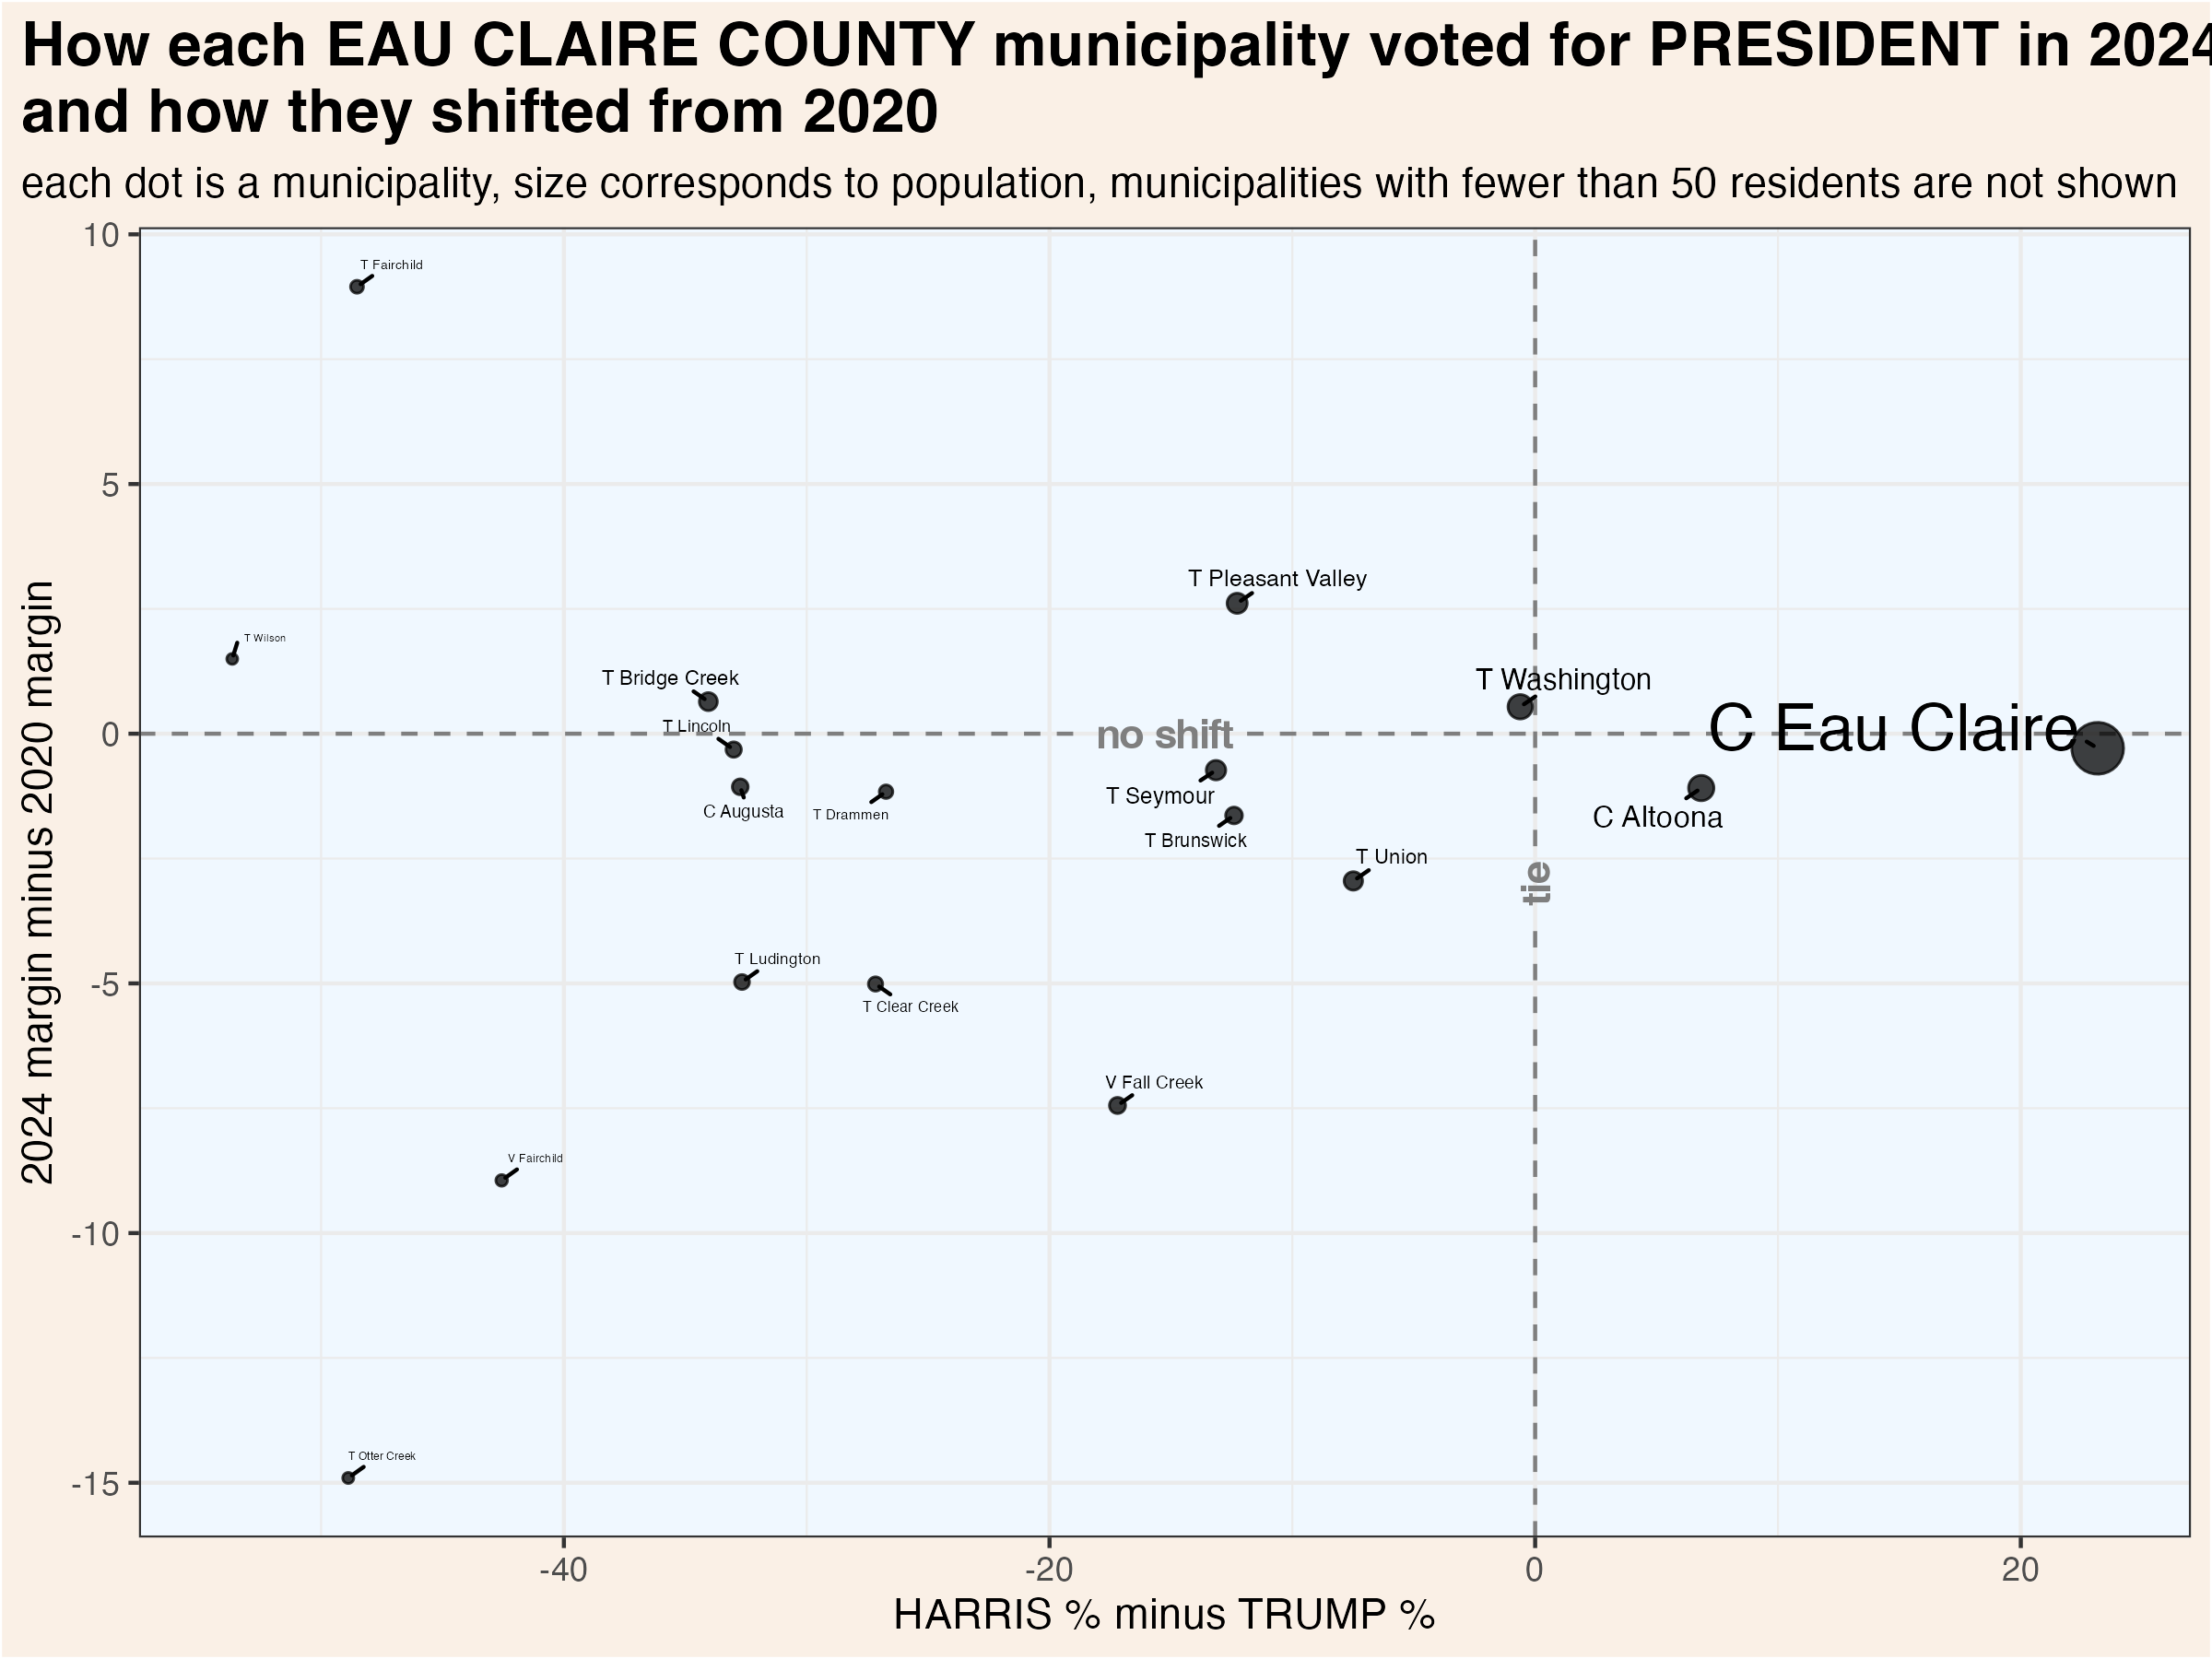
To more clearly illustrate recent changes in municipality voting trends, these scatterplots compare the most recent vote for president and senator with the shift from that office’s previous election.

These maps show show every election result since 2000 in each municipality.


Click each column name to sort its values.
20.4 Supreme Court Election Results
Wisconsin’s Supreme Court has 7 justices, each of whom are elected to 10 year terms in statewide elections held in April. State law prohibits more than one Supreme Court election from being held in a single year. If a seat becomes vacant, the governor appoints a replacement who serves until the next year in which no court election is already scheduled. If more than two candidates achieve ballot access, a nonpartisan, top-two primary is held in February.
Court elections are formally nonpartisan, but candidates are usually supported by either liberals or conservatives. In recent years, it has become common for the Democratic and Republican parties to endorse and actively campaign on behalf of favored judicial candidates. The liberal and conservative labels indicated in the following graphs and tables are based on widely recognized tendencies, not any formal affiliation.
20.4.1 County Election Results
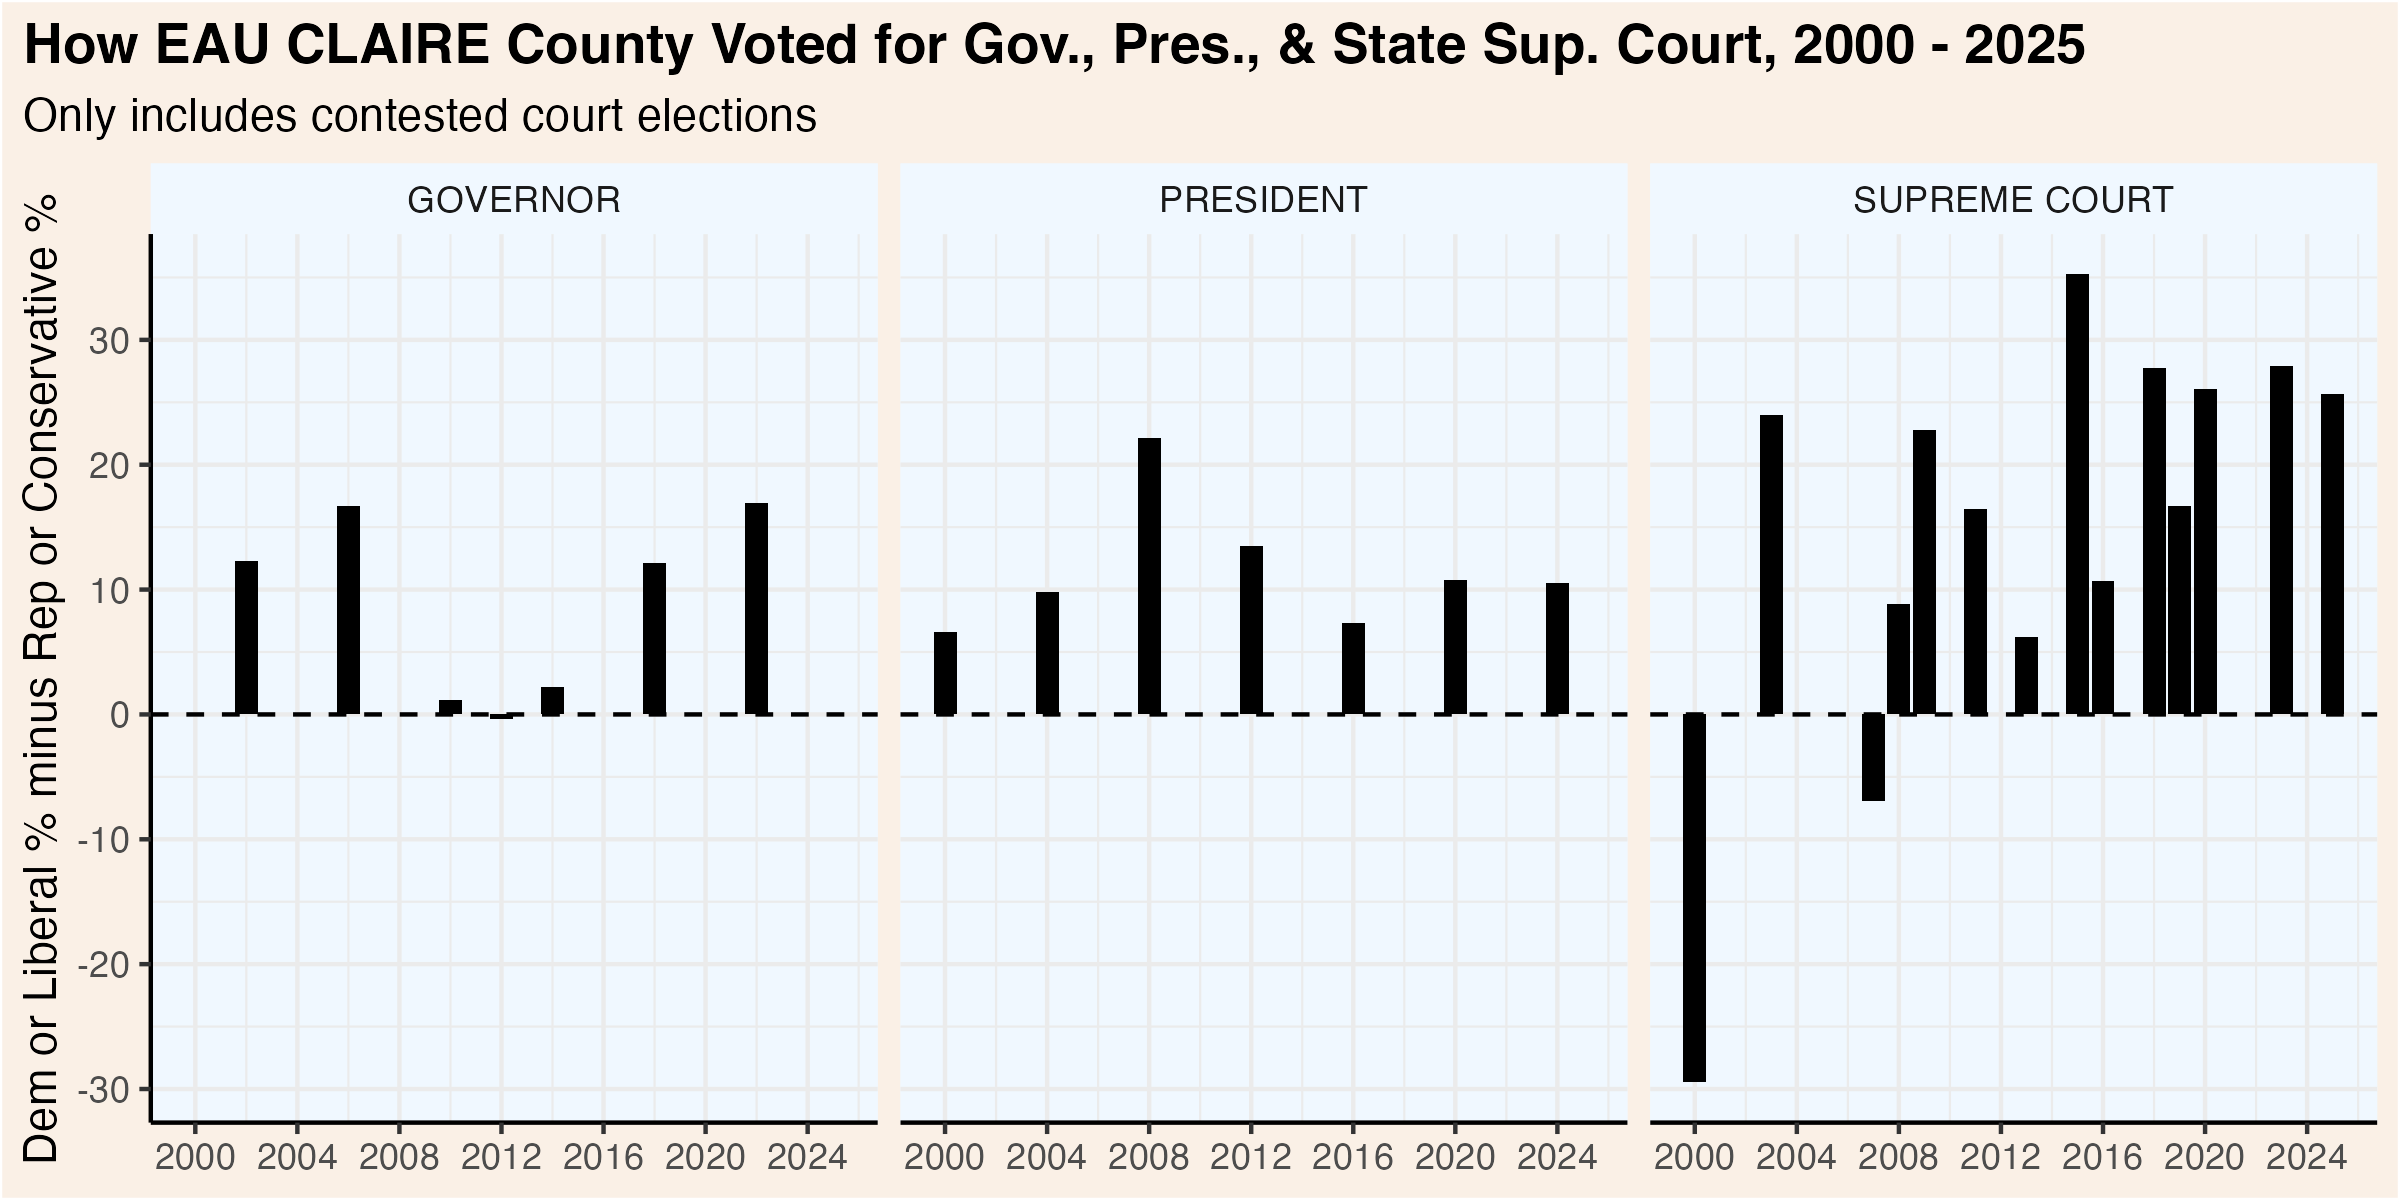
This graphic compares how presidential, gubernatorial, and court elections have trended over the past quarter century. Click the “Table” tab to see detailed results for the Supreme Court races.
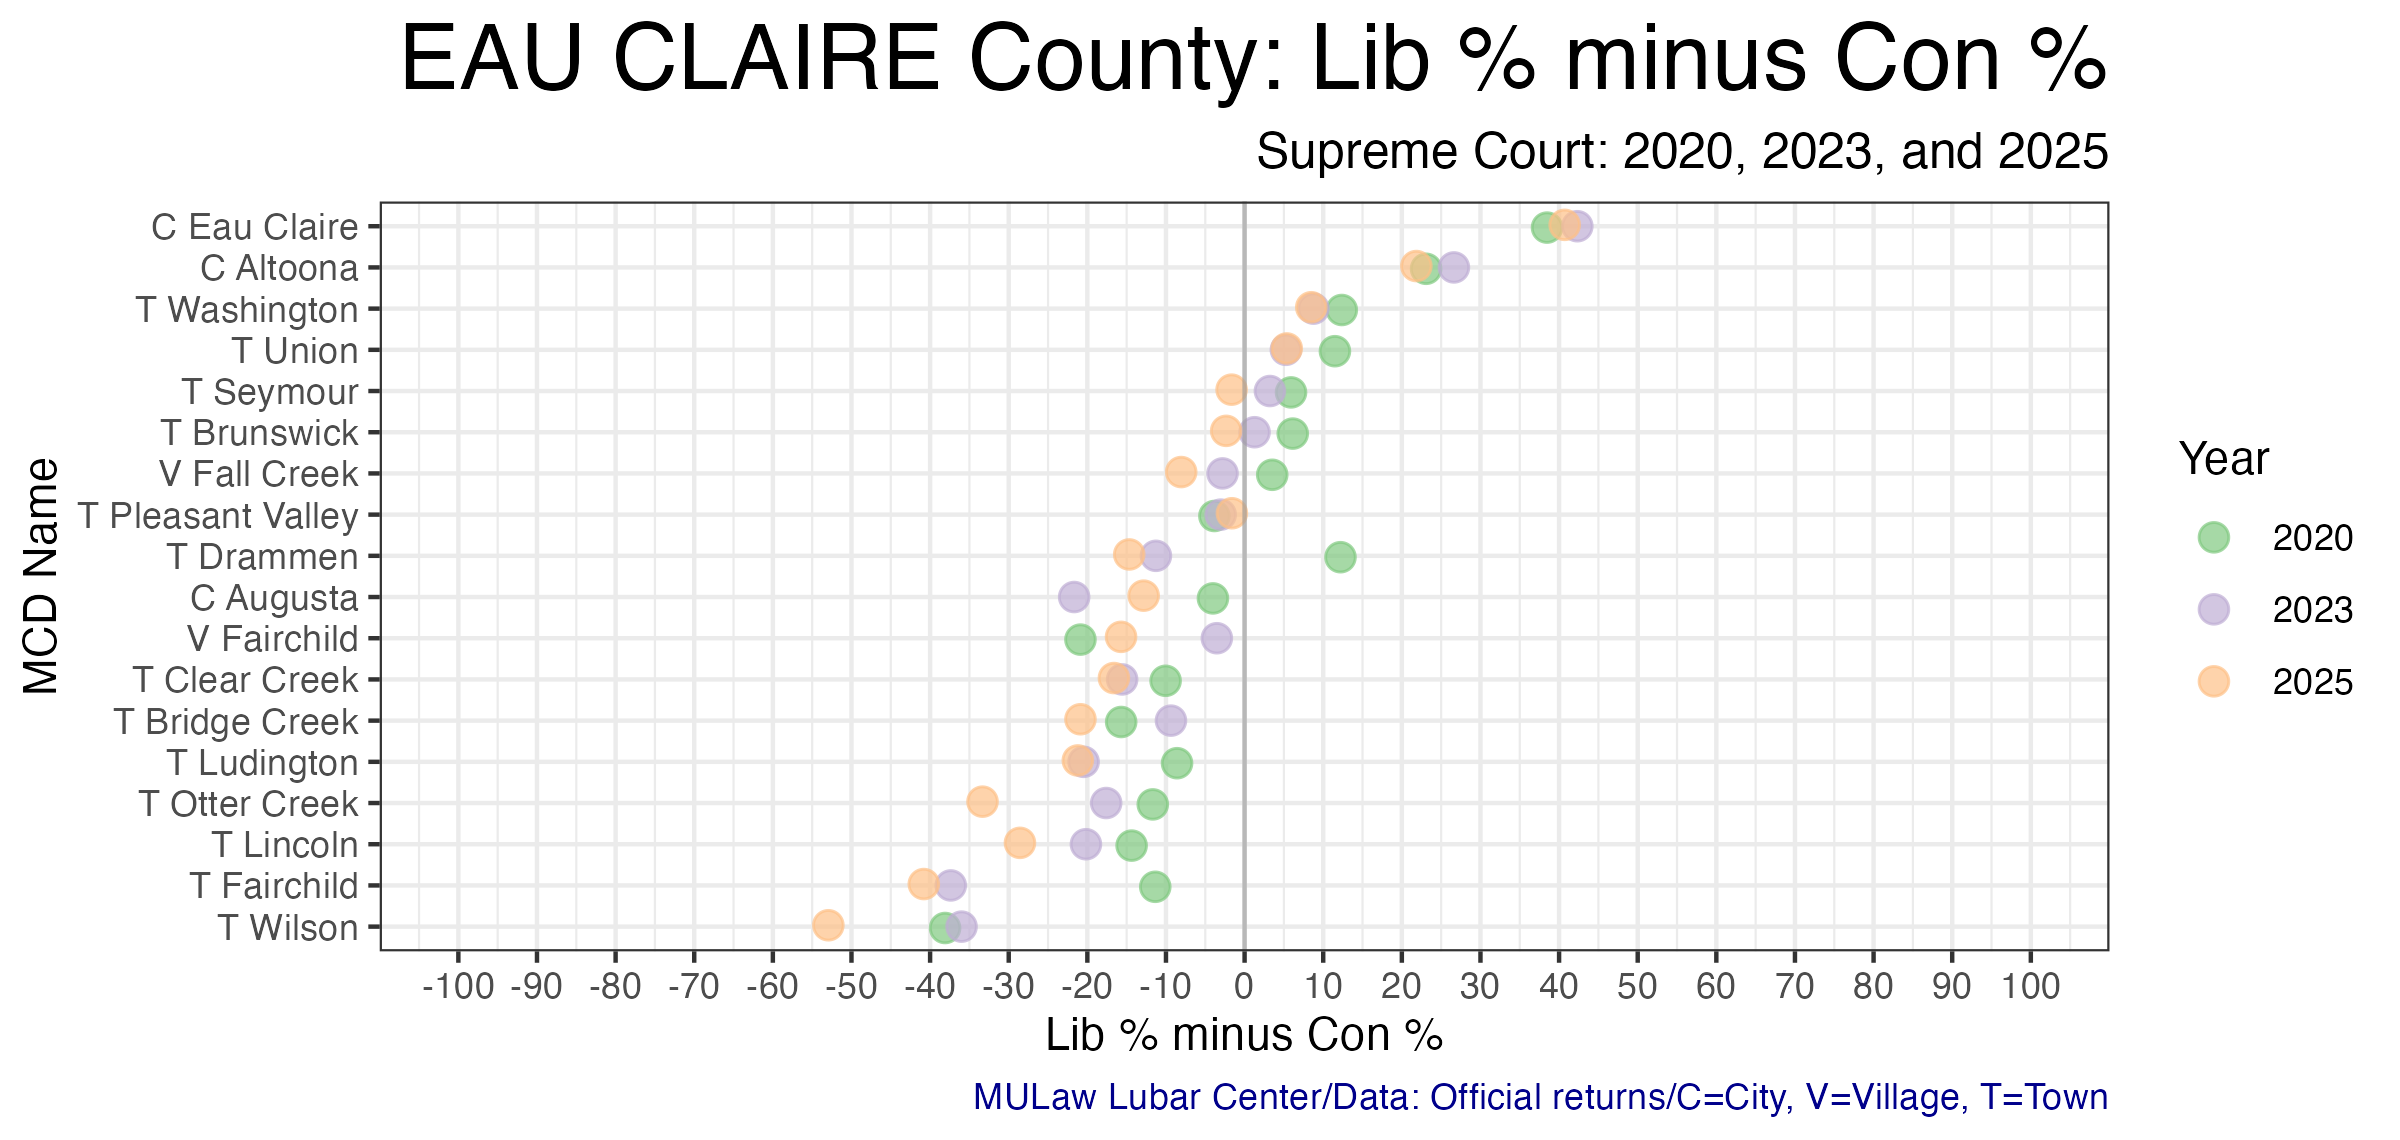
20.4.2 Municipality Election Results
The following table shows the results of each Supreme Court election by municipality. The graphic visualizes the shifts over the past three court elections.