71 Waupaca
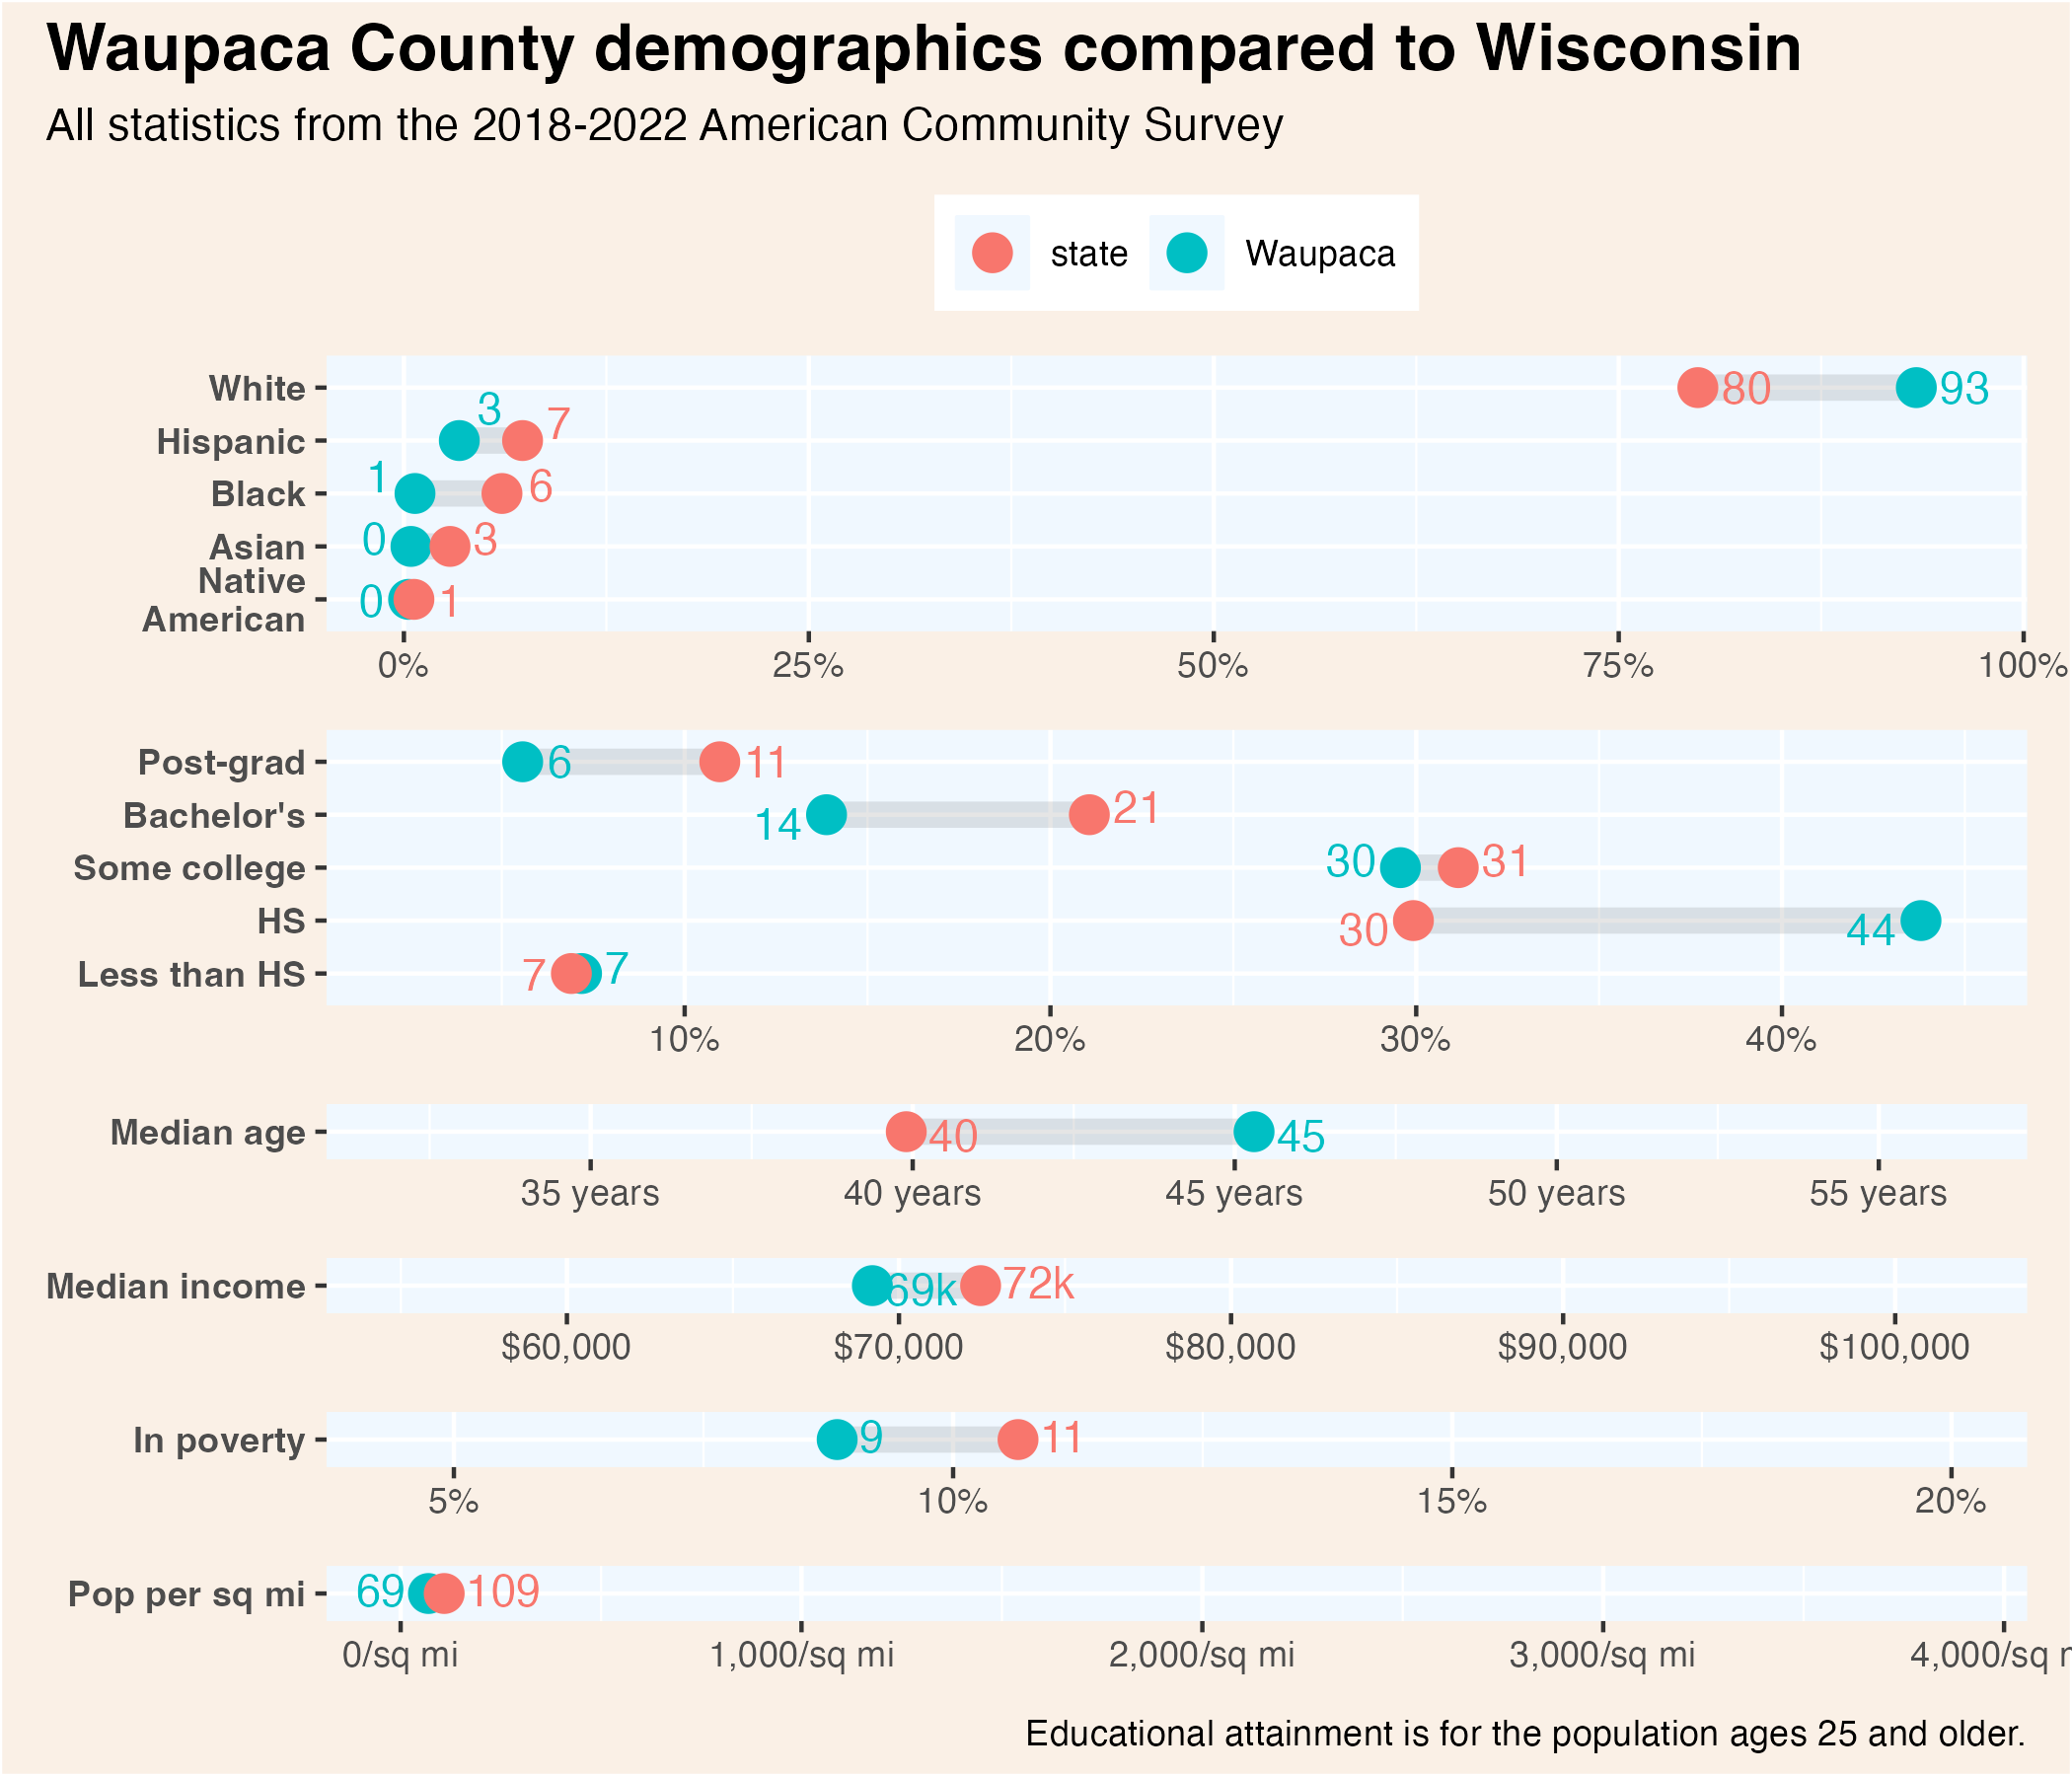
Waupaca County (pop. 52,000) is located in central Wisconsin about 60 miles west of Green Bay. The county is 93% white and an unusually high share of adults have just a high school degree. The median household income is similar to the state average. Politically, the county leans firmly Republican.
71.1 Demographics
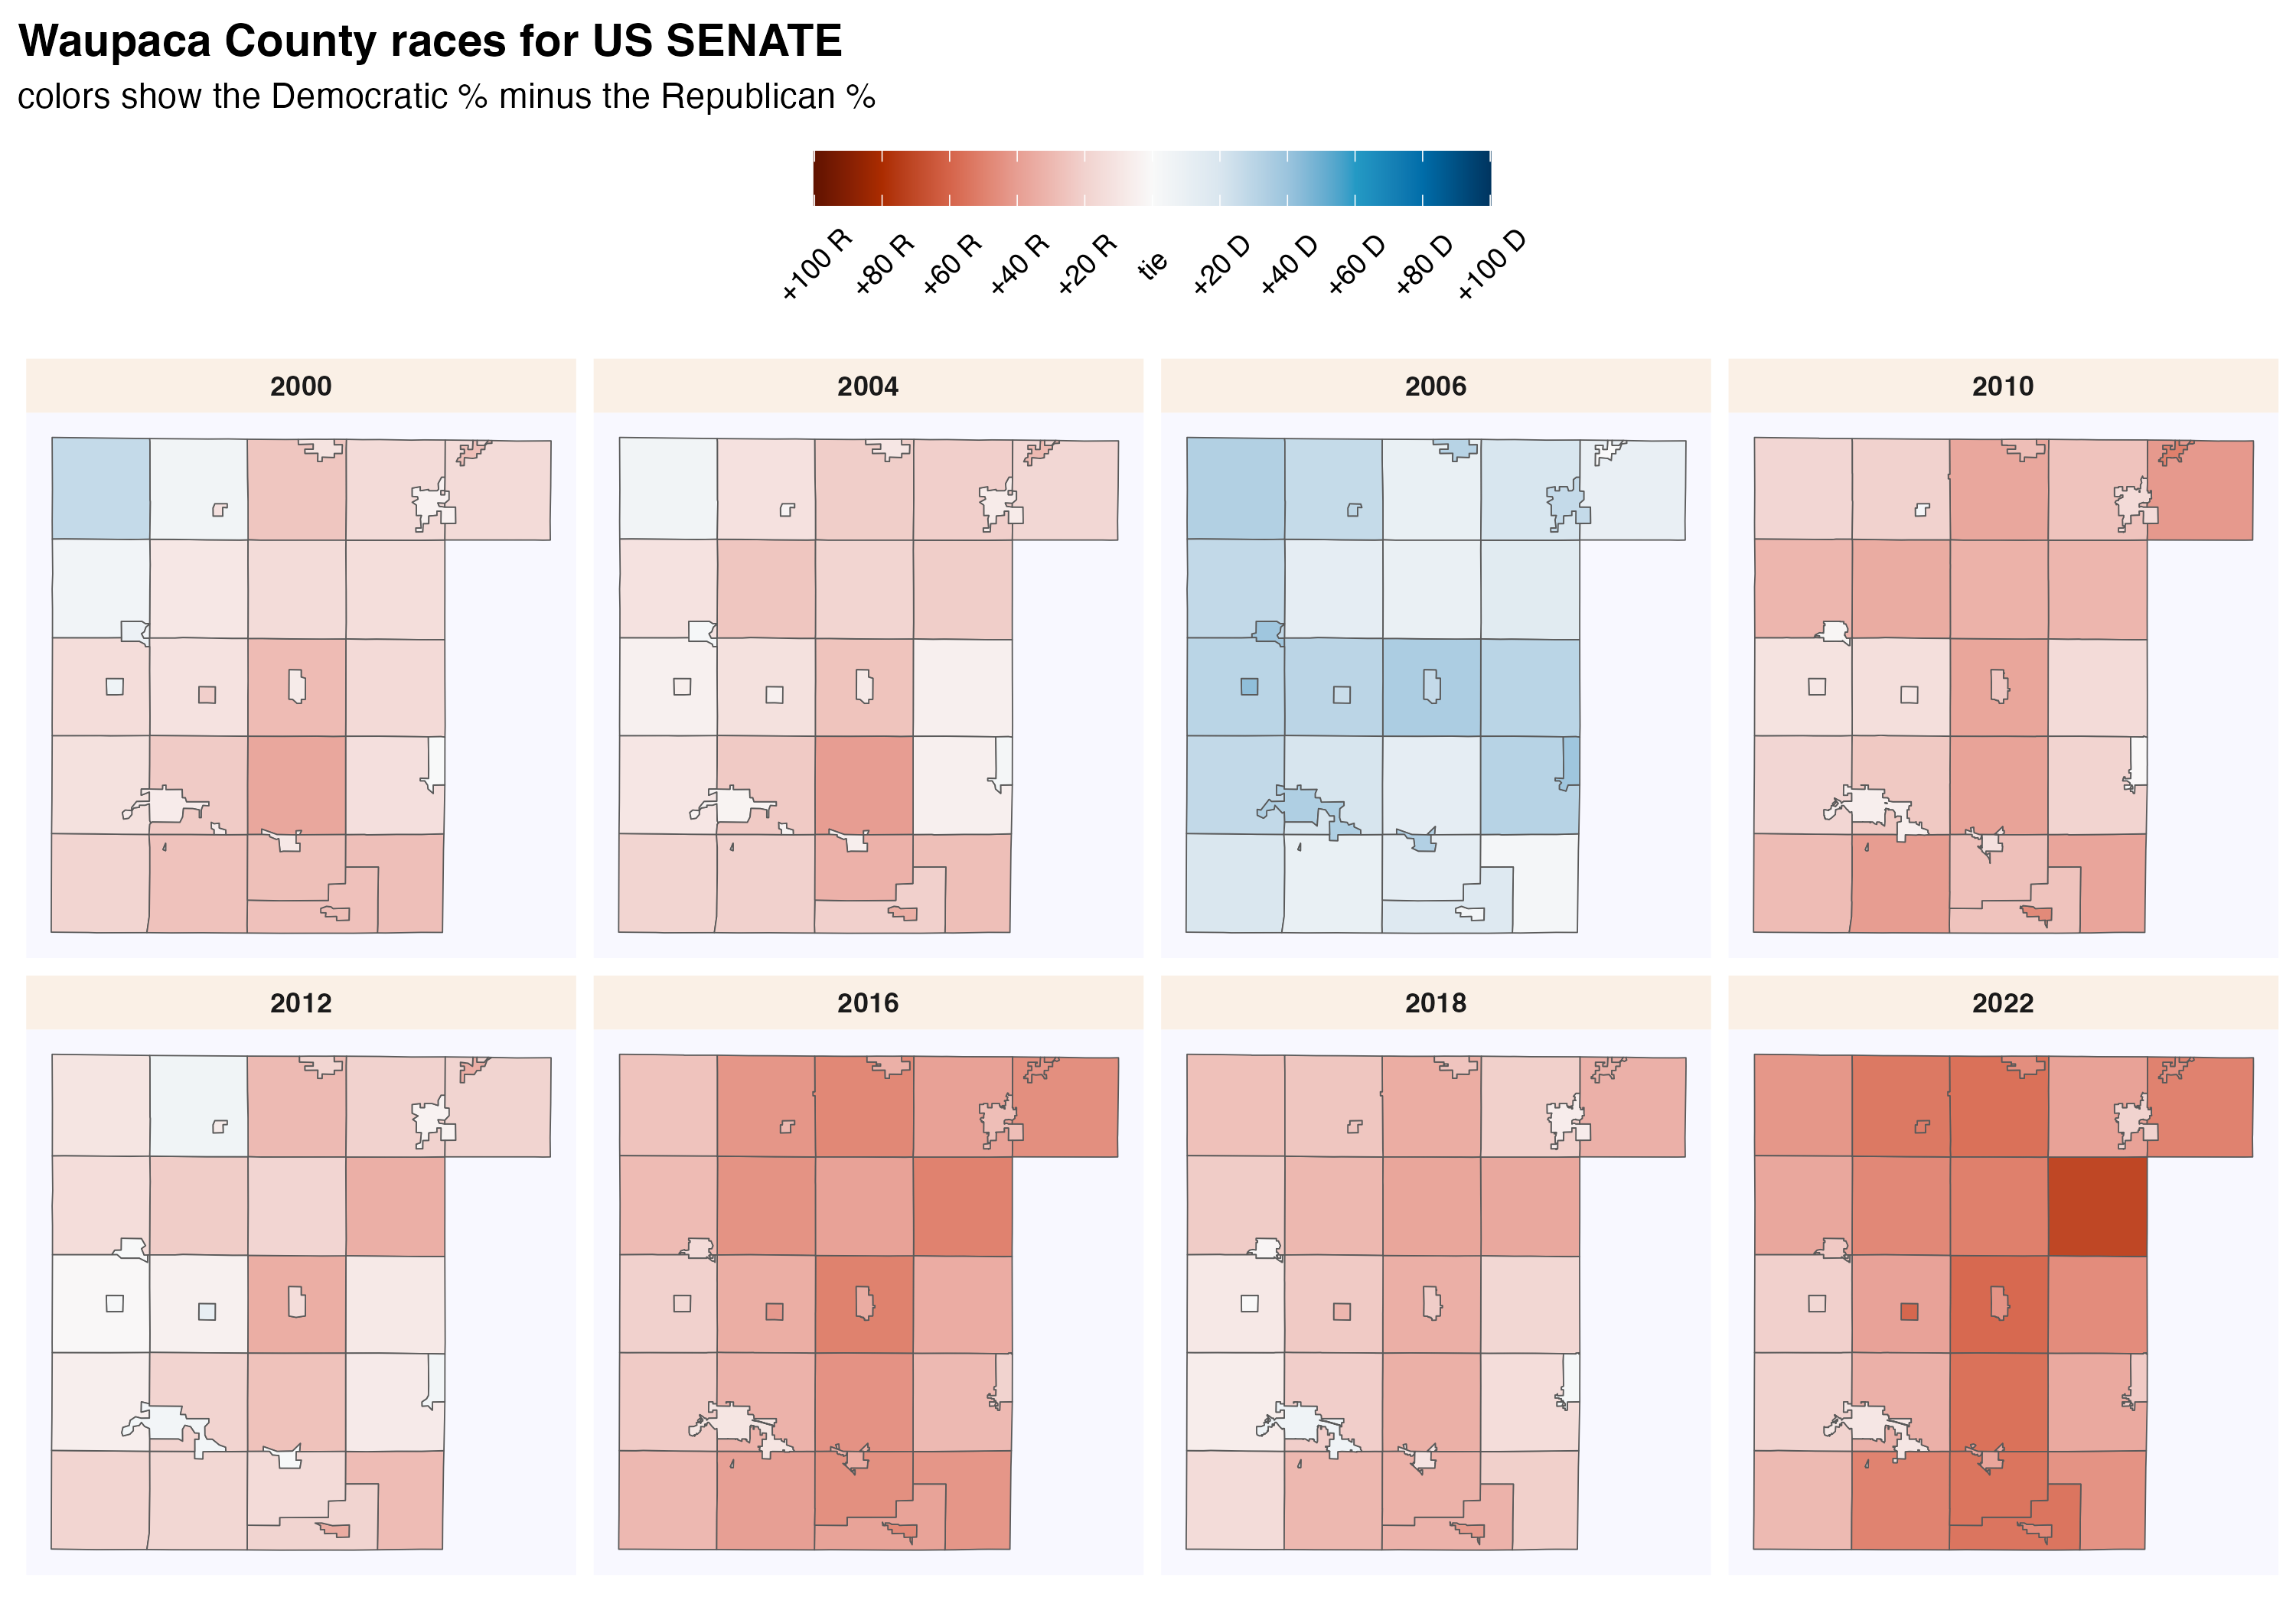
71.2 County Election Results
Click each column name to sort its values.
71.3 Municipality Election Results
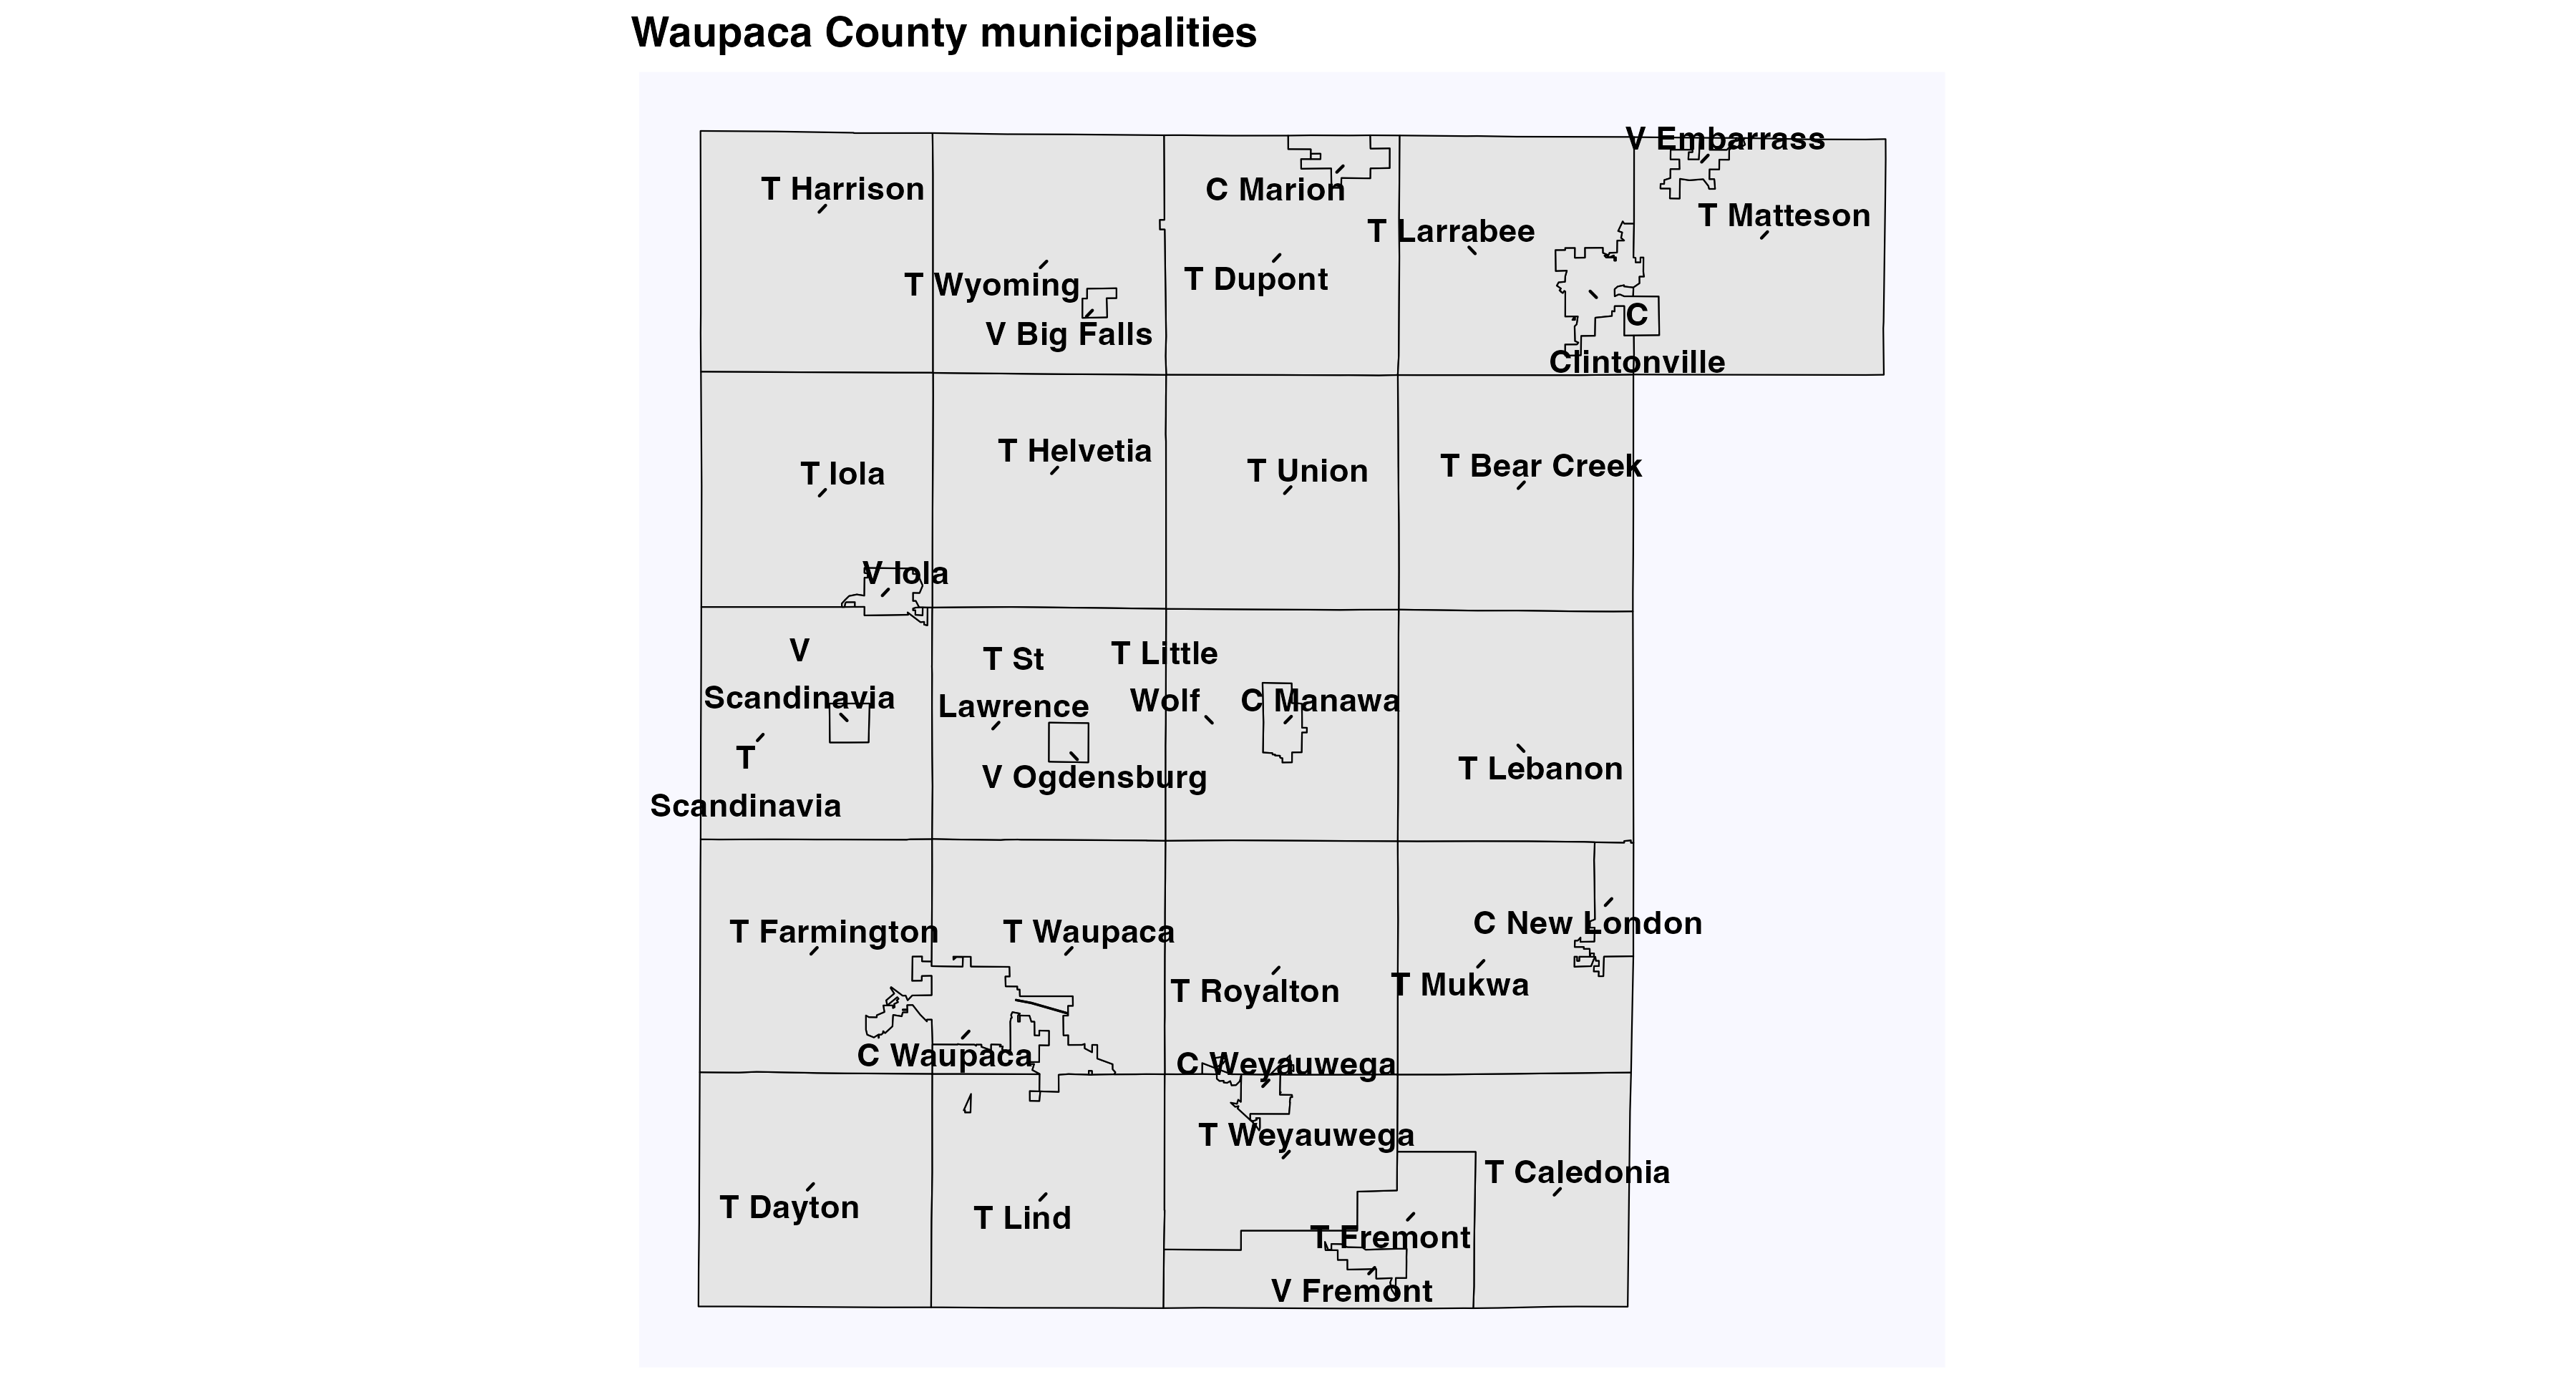
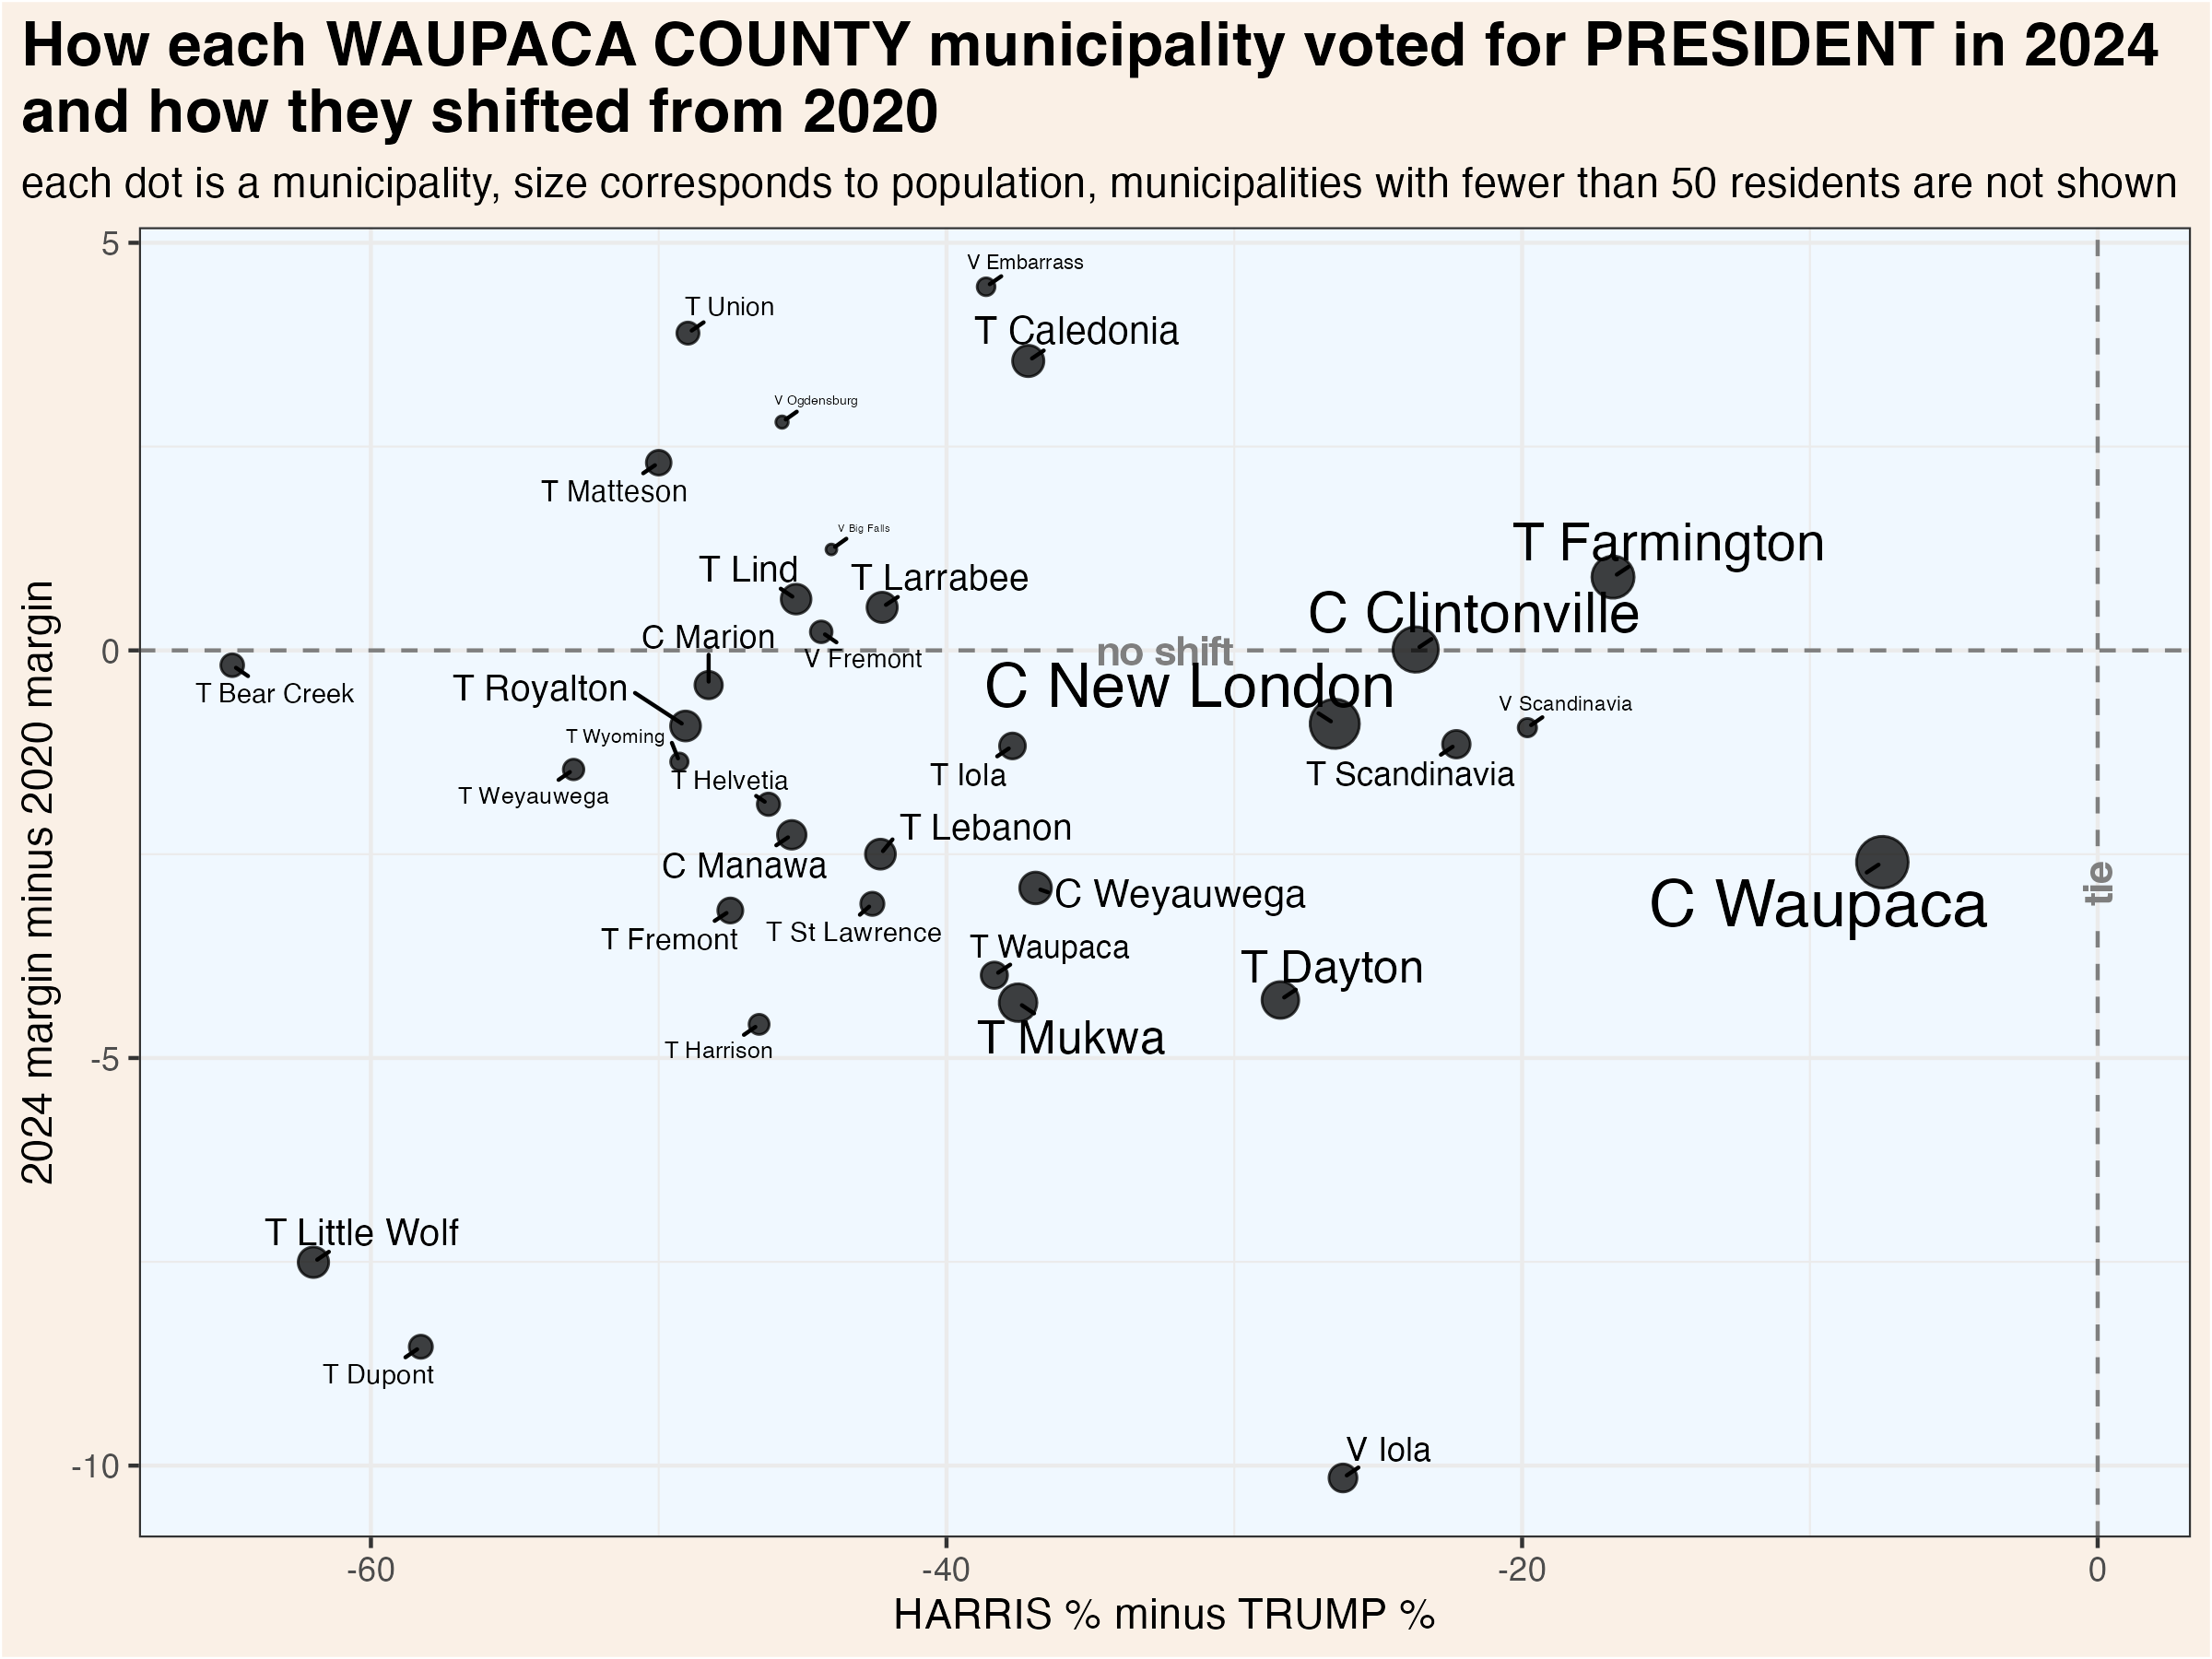
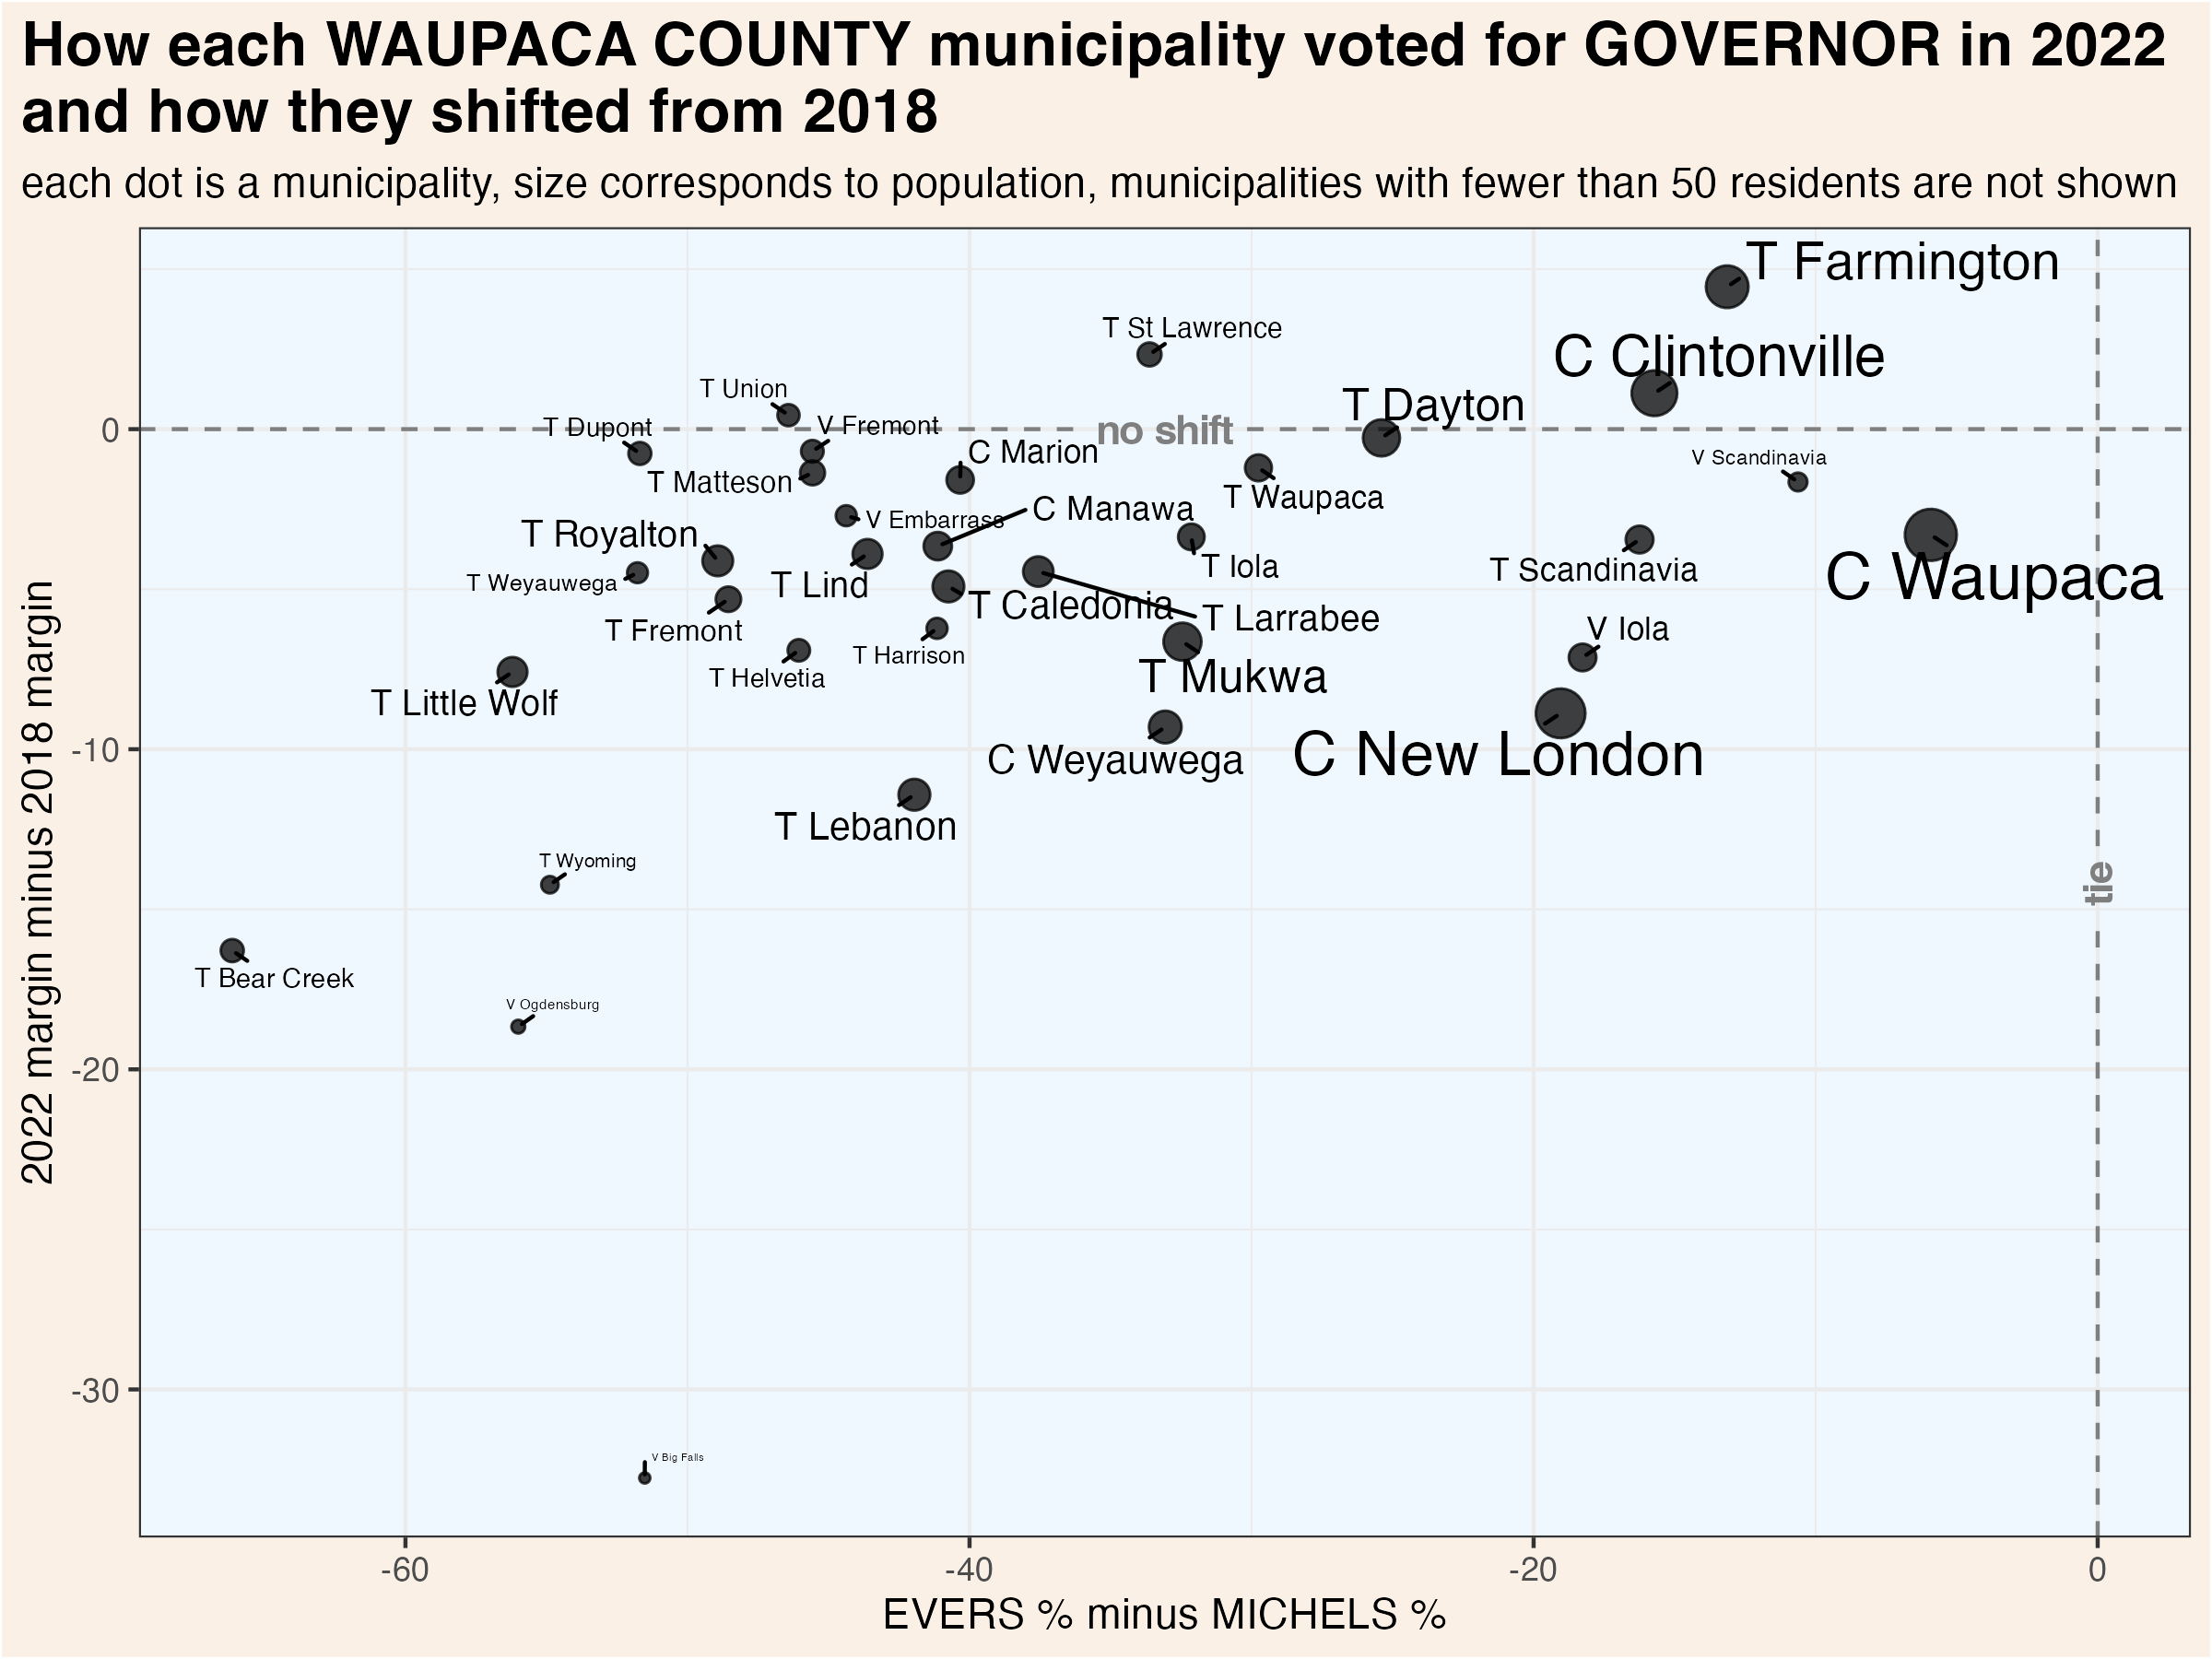
Only about 10% of the county lives in the largest municipality, Waupaca city. The remainder is spread across numerous other communities; there are 18 with between 1,000 and 5,600 residents. All of these municipalities lean Republican, though the City of Waupaca is the most competitive.
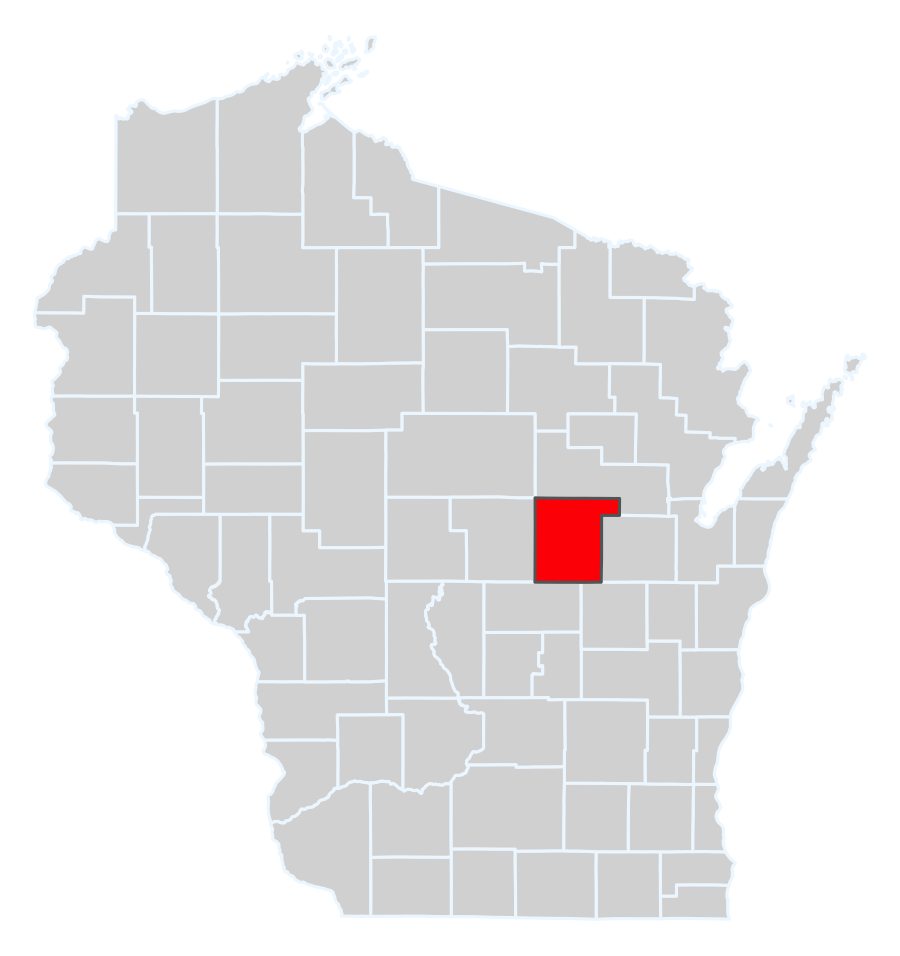
This map shows the location of each municipality in the county, as it existed in 2022.
These dot plots show the most recent election results in each municipality.
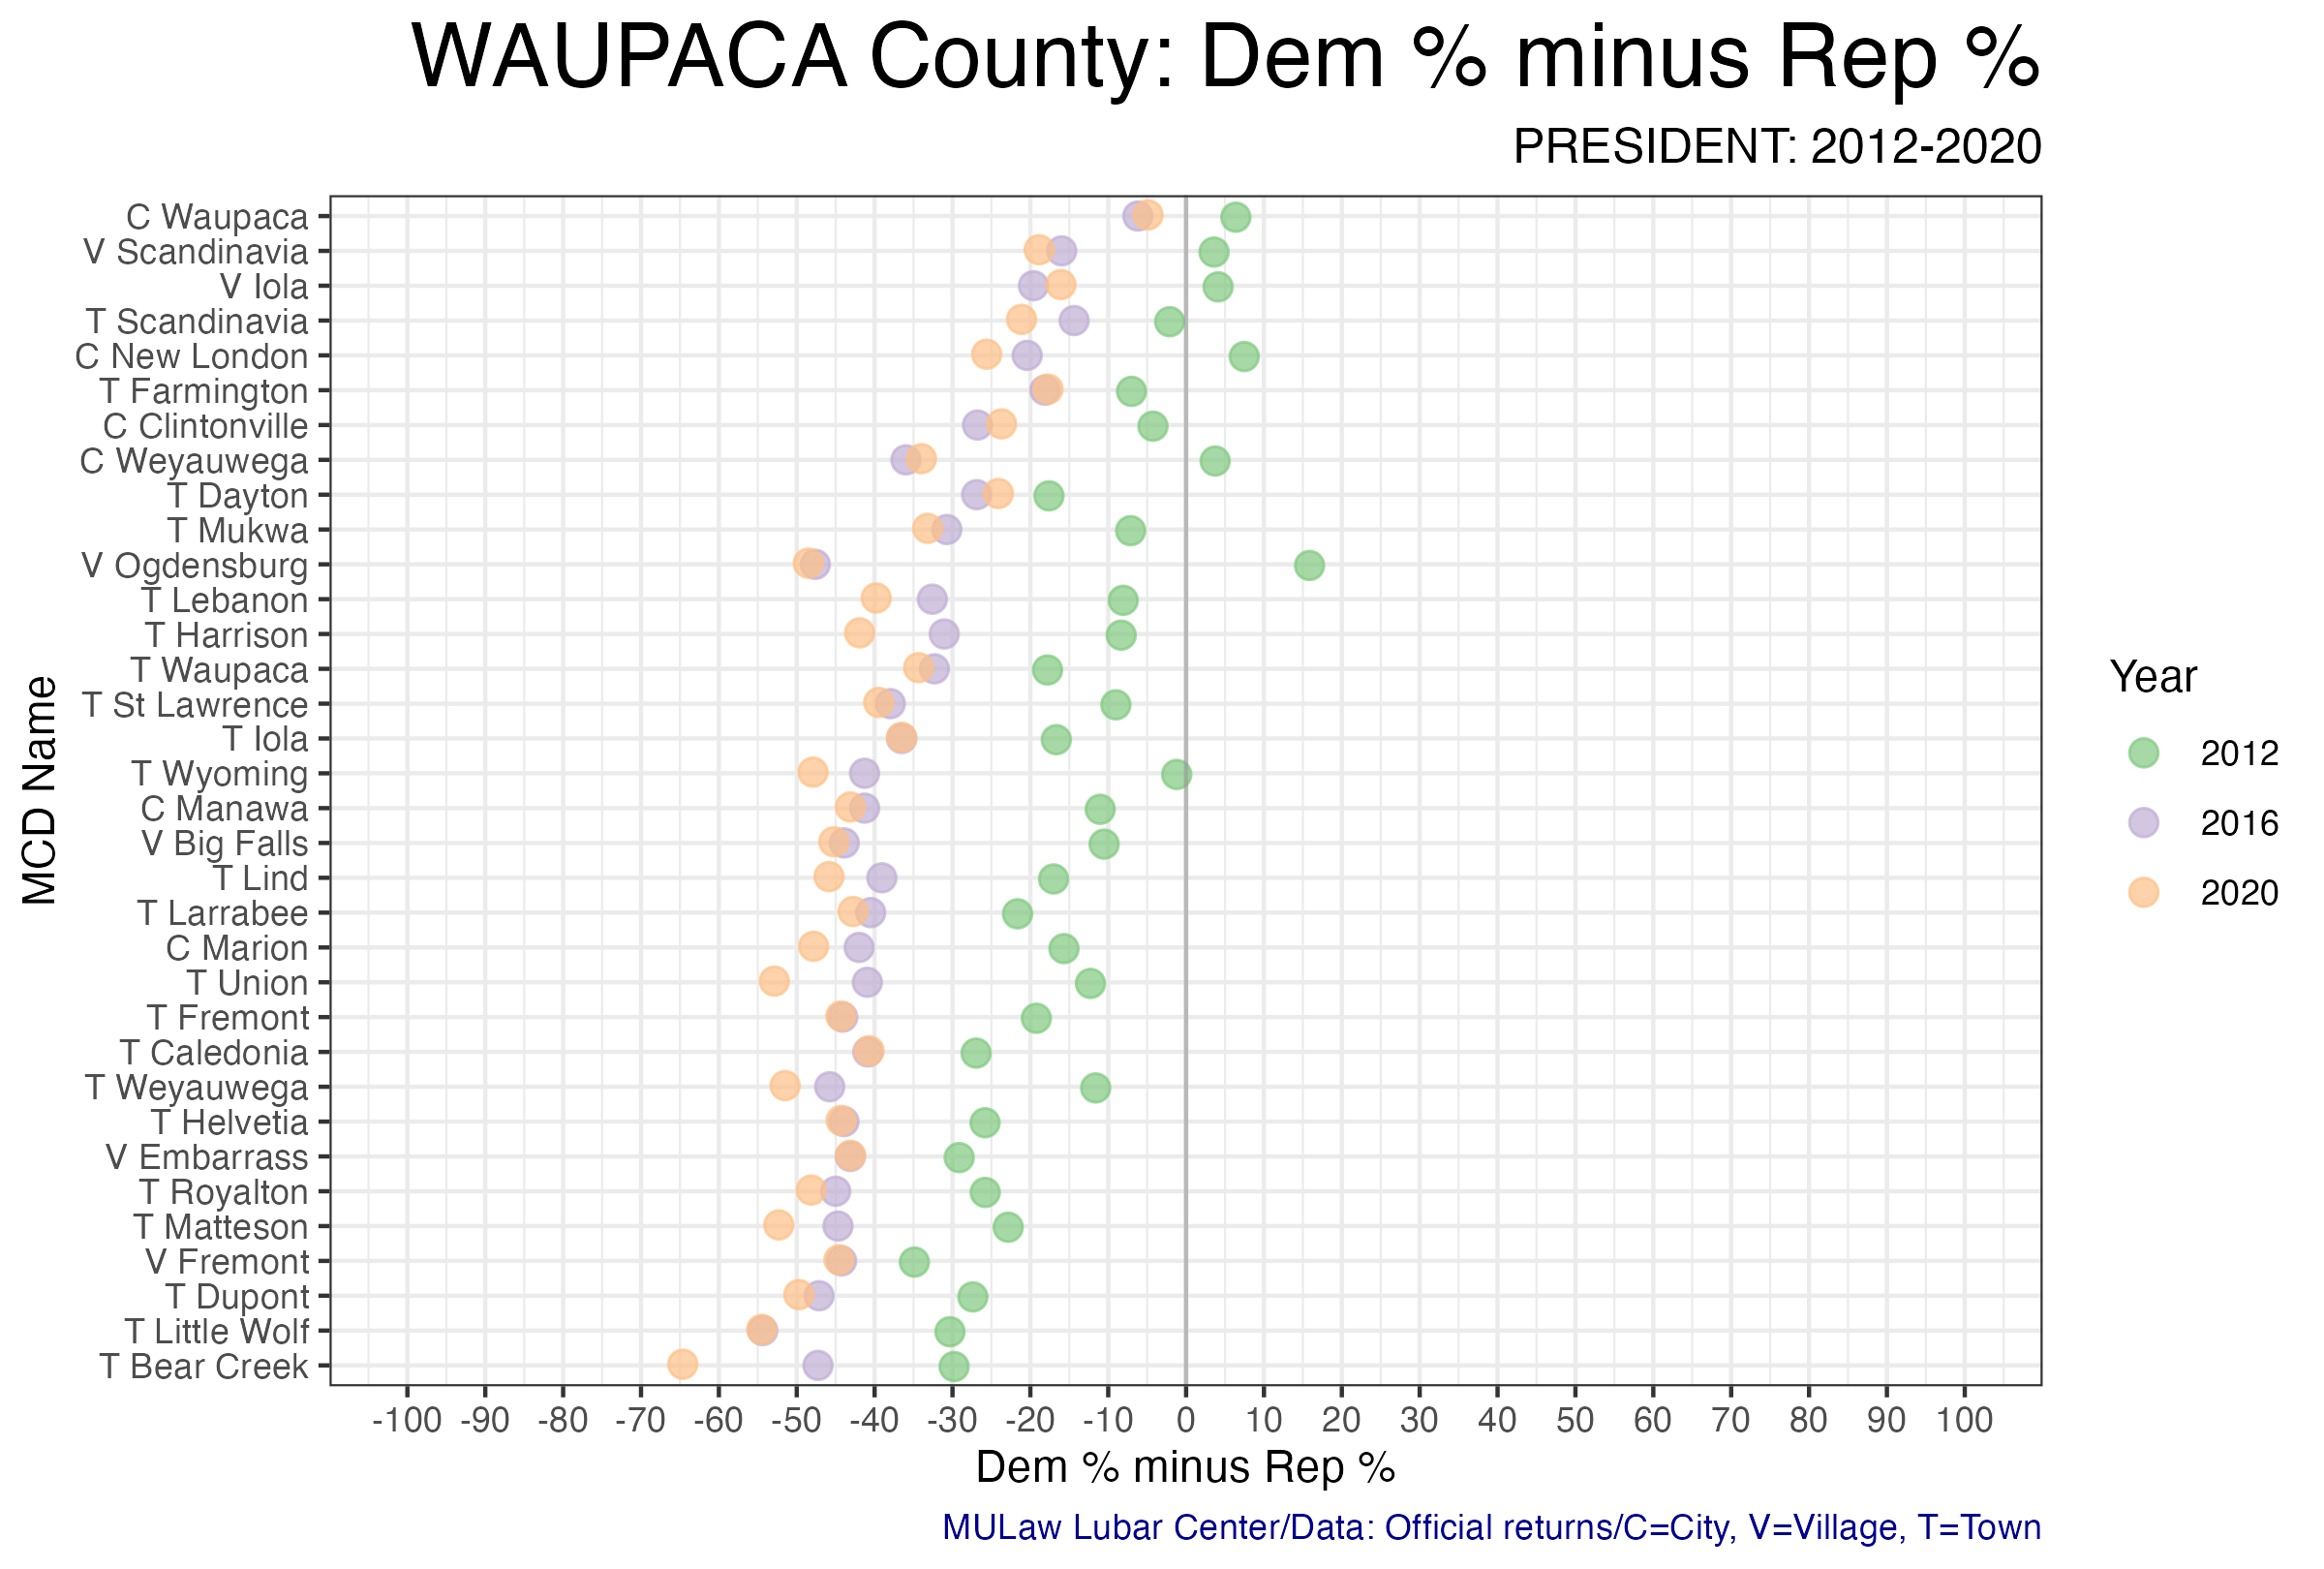
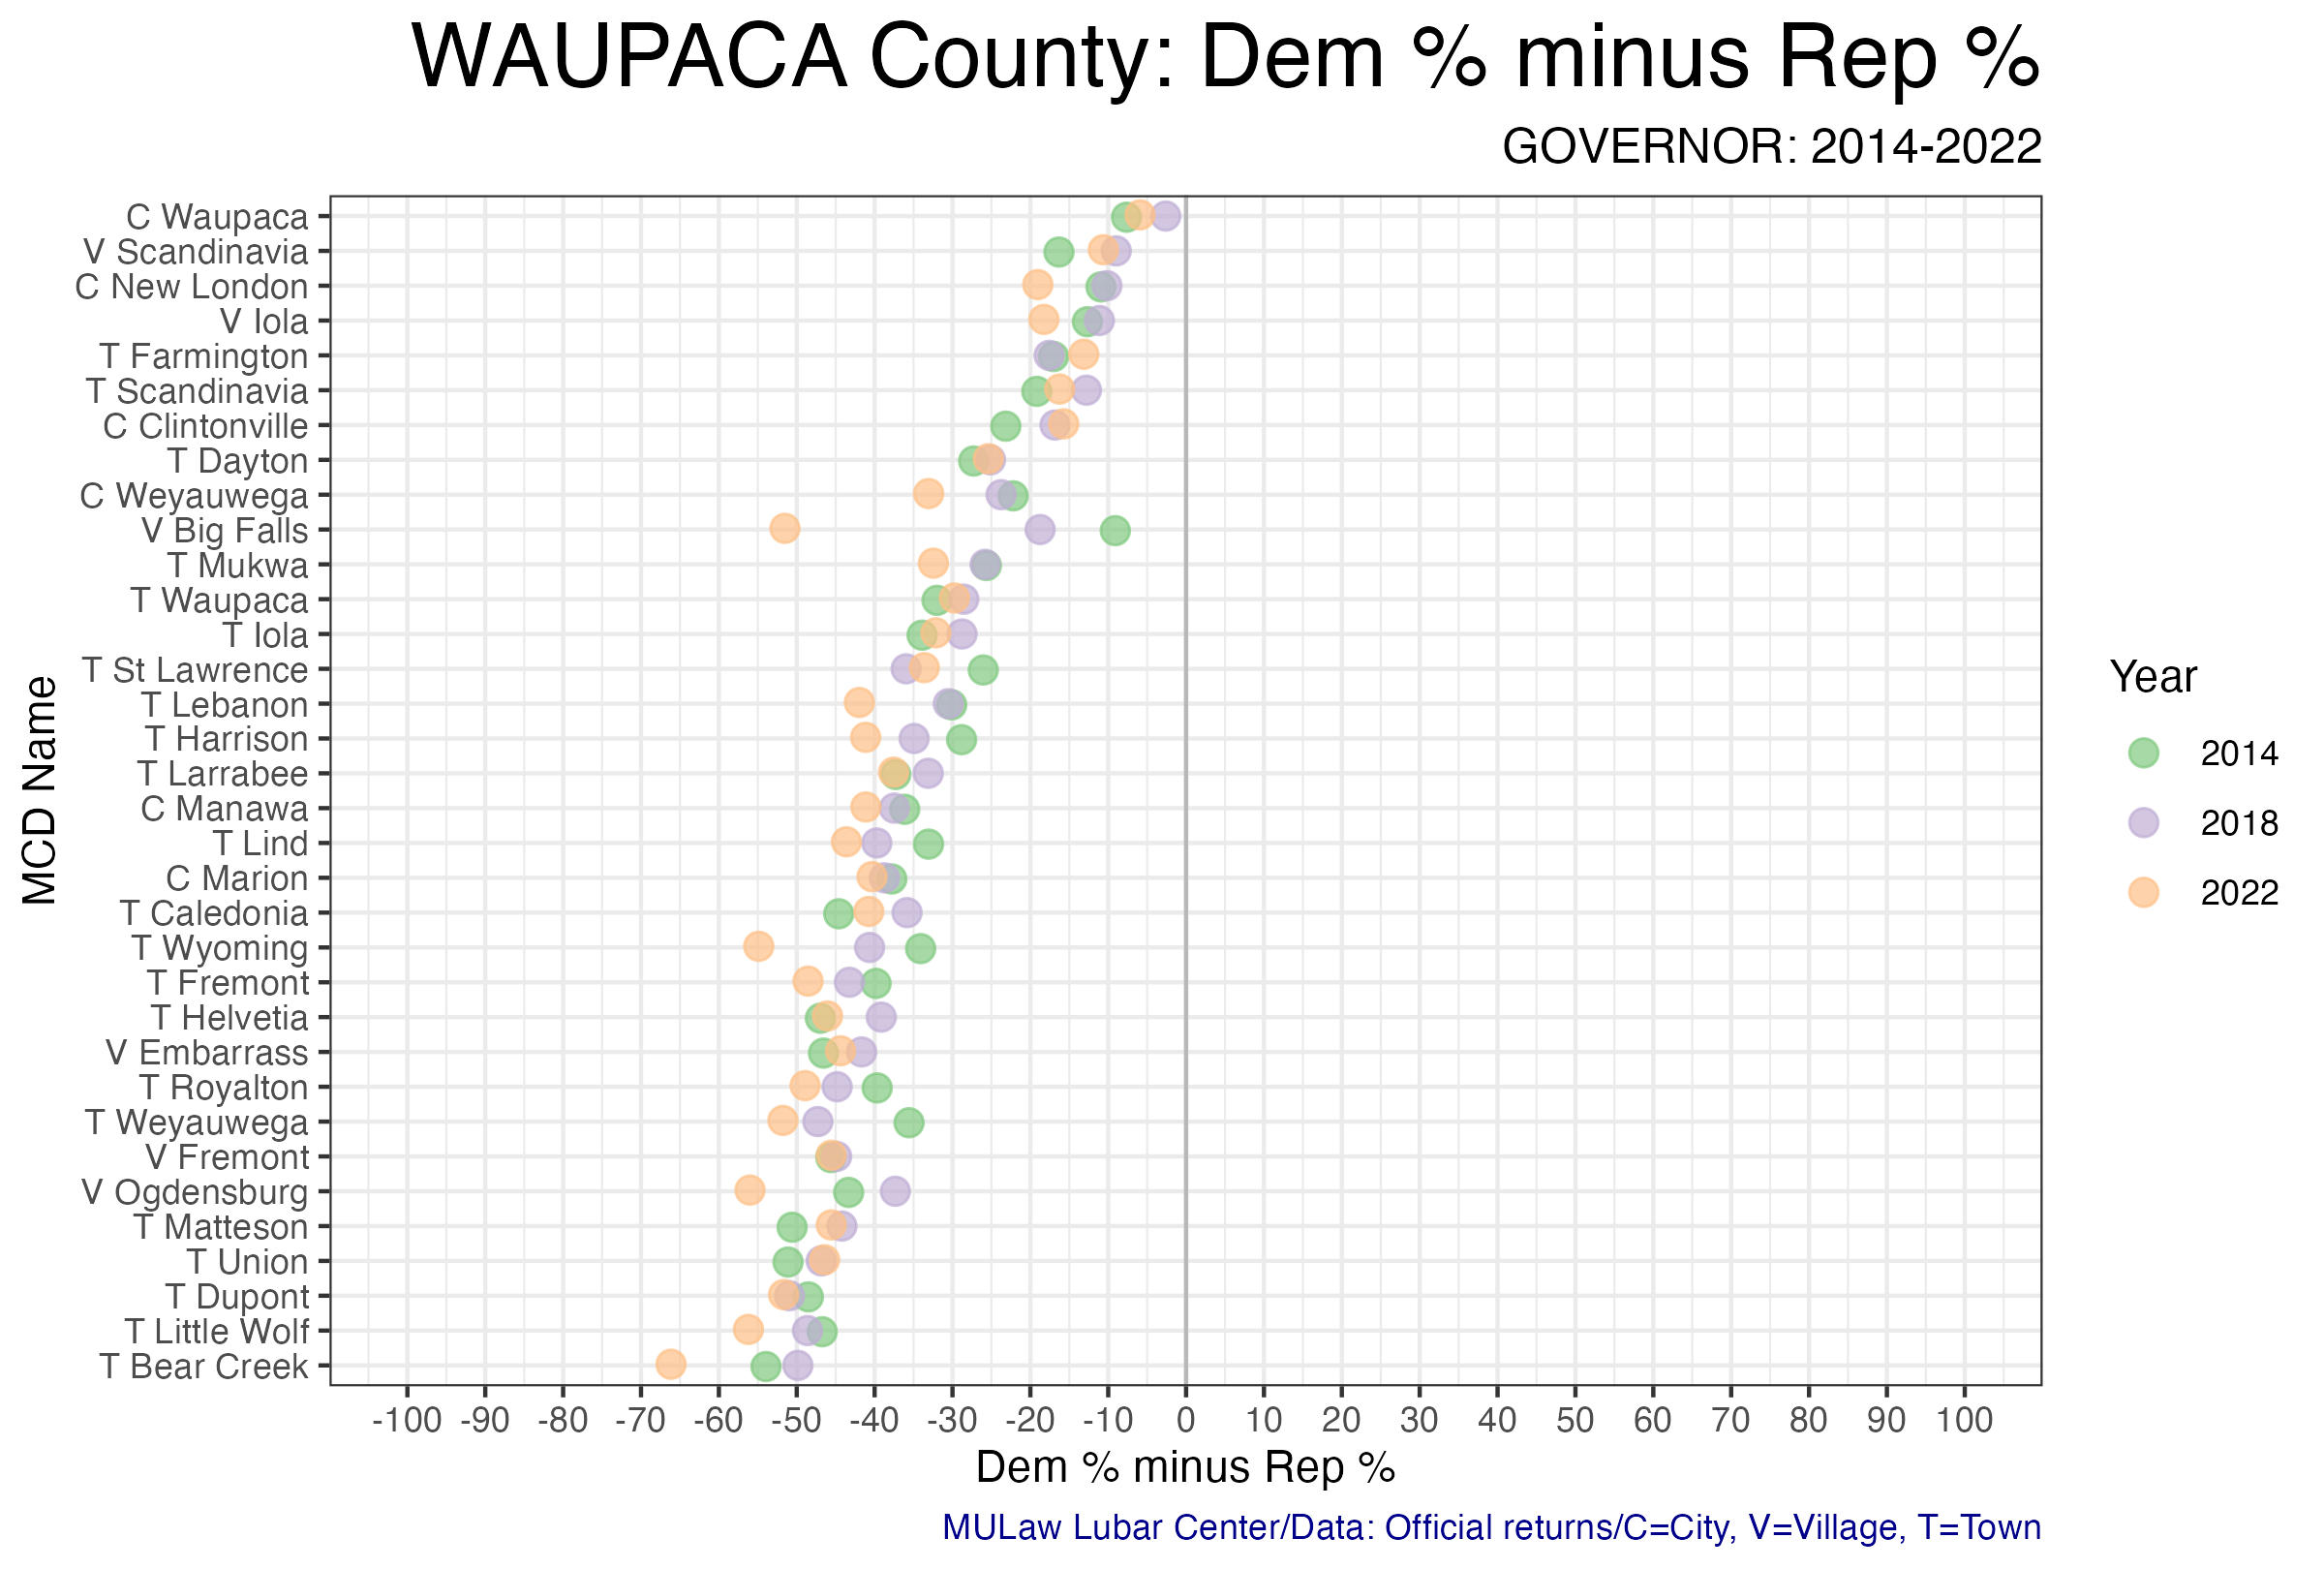
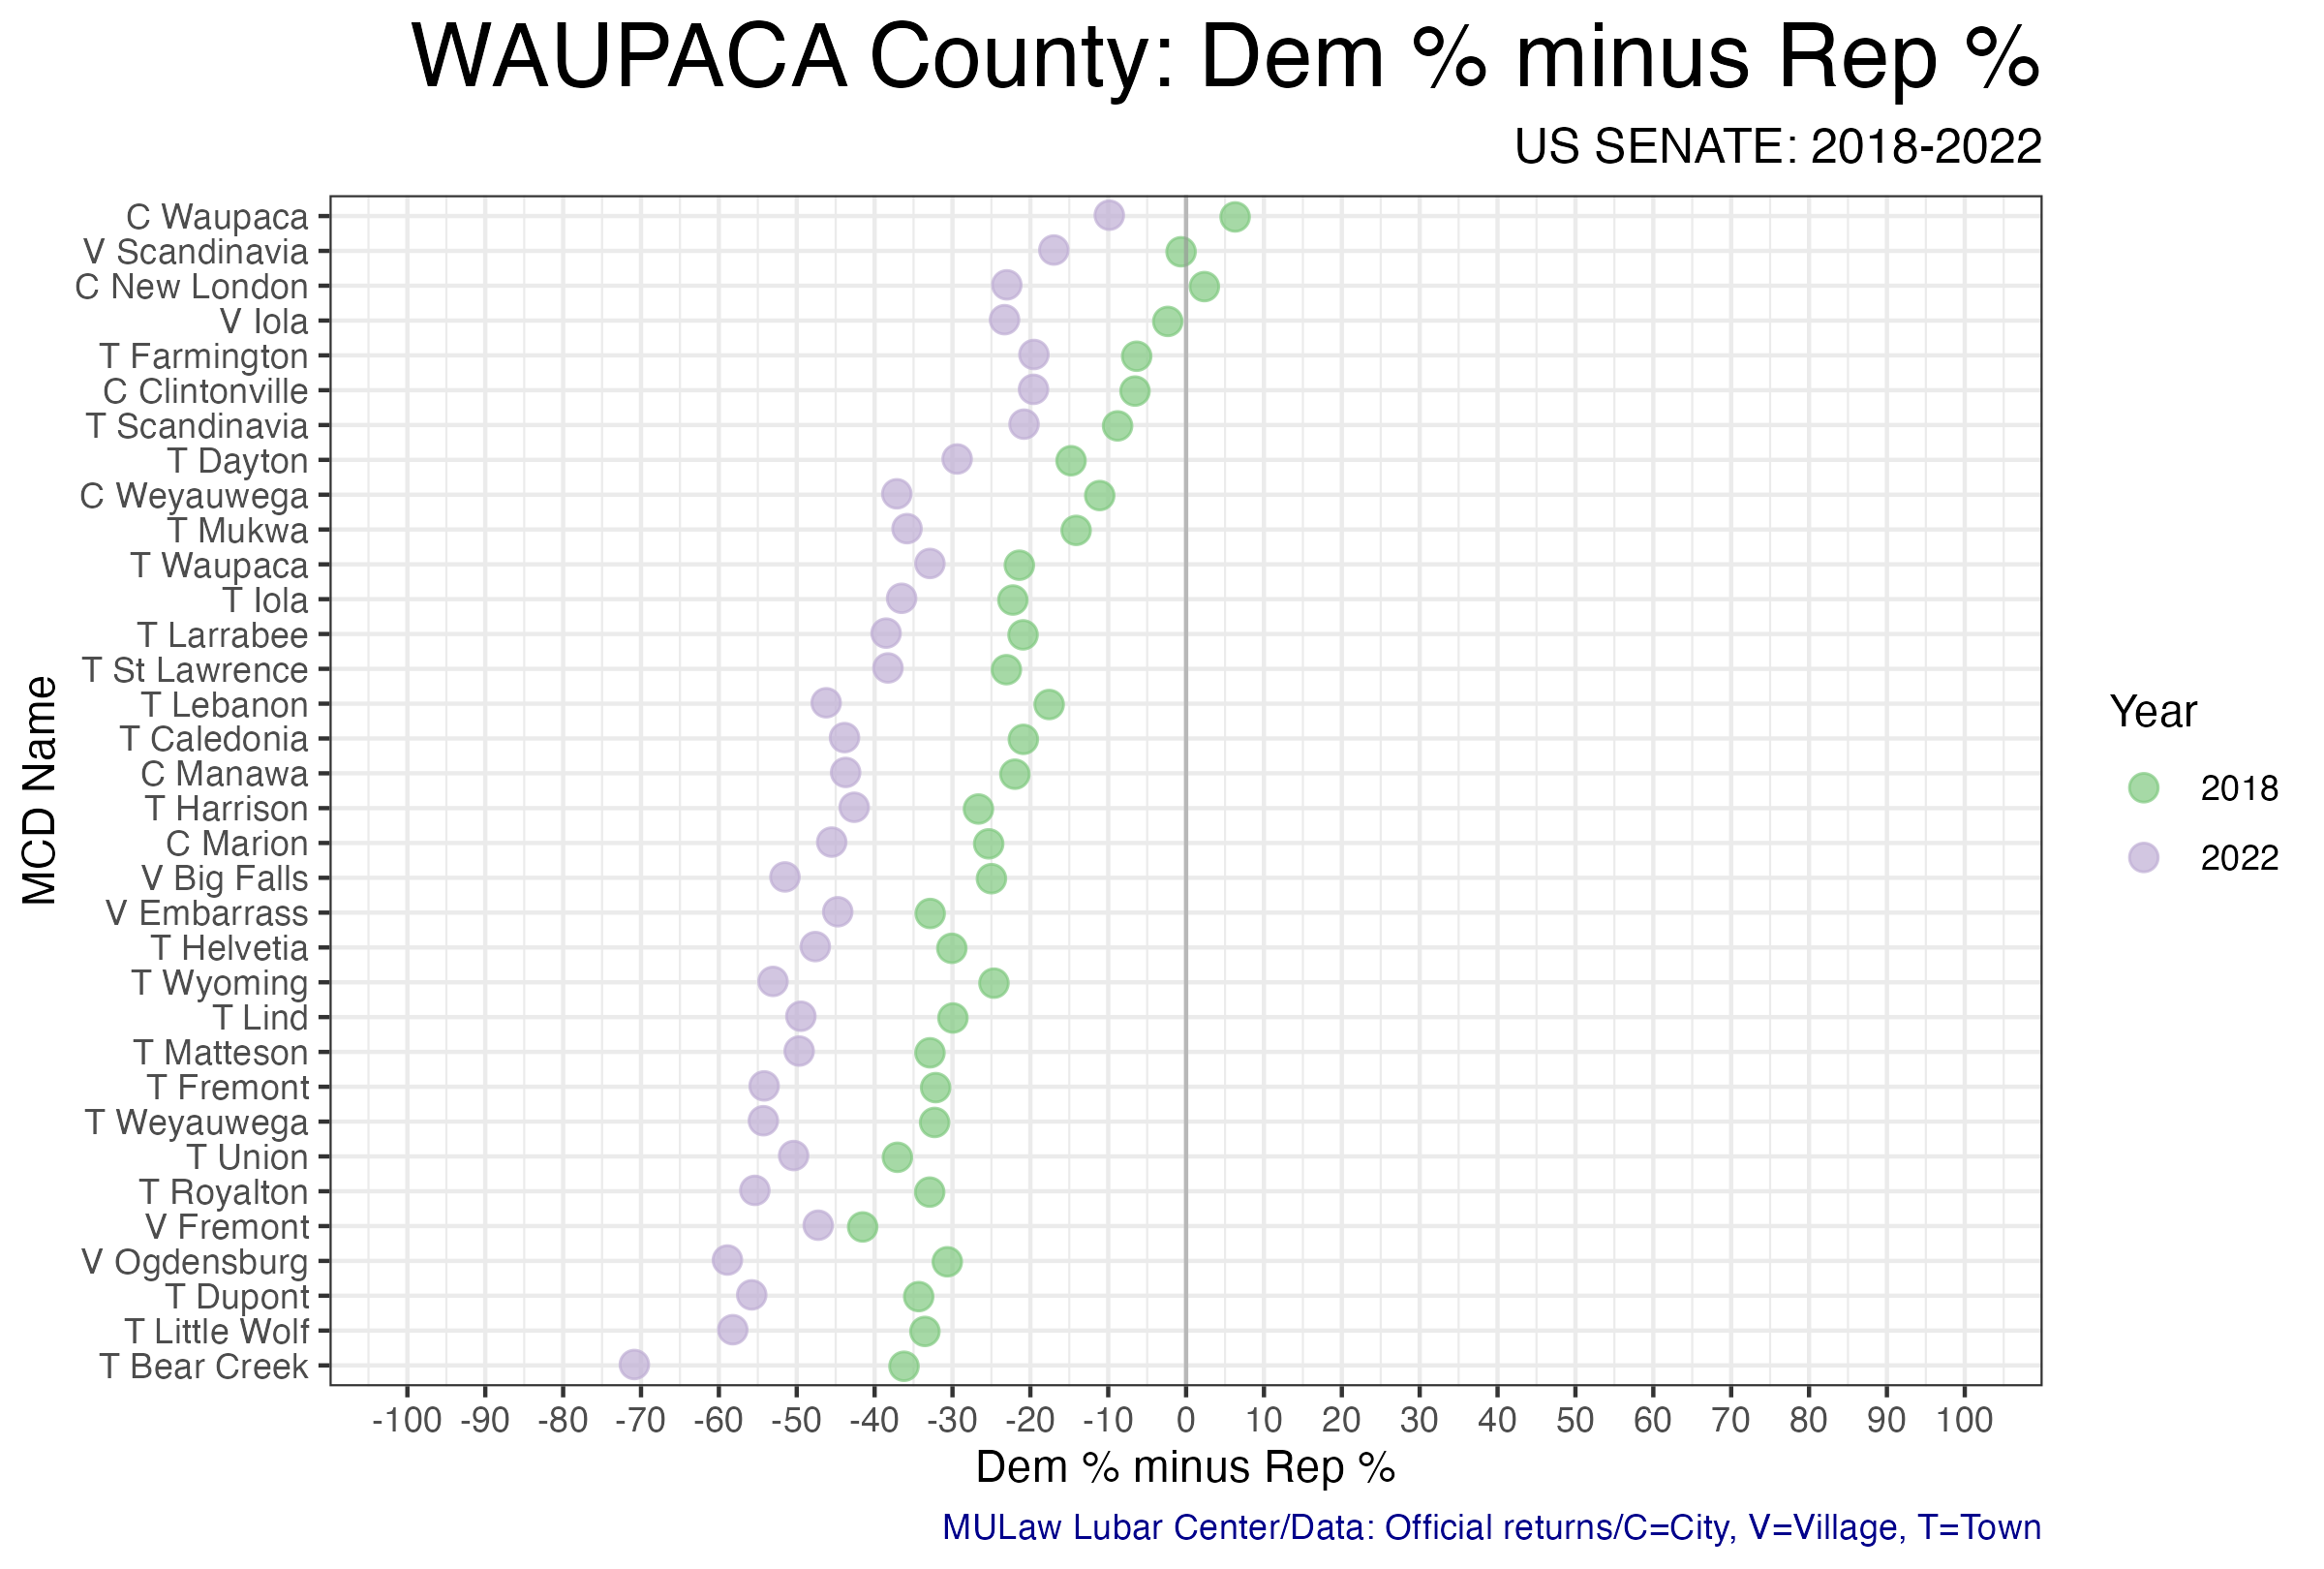
To more clearly illustrate recent changes in municipality voting trends, these scatterplots compare the most recent vote for president and senator with the shift from that office’s previous election.
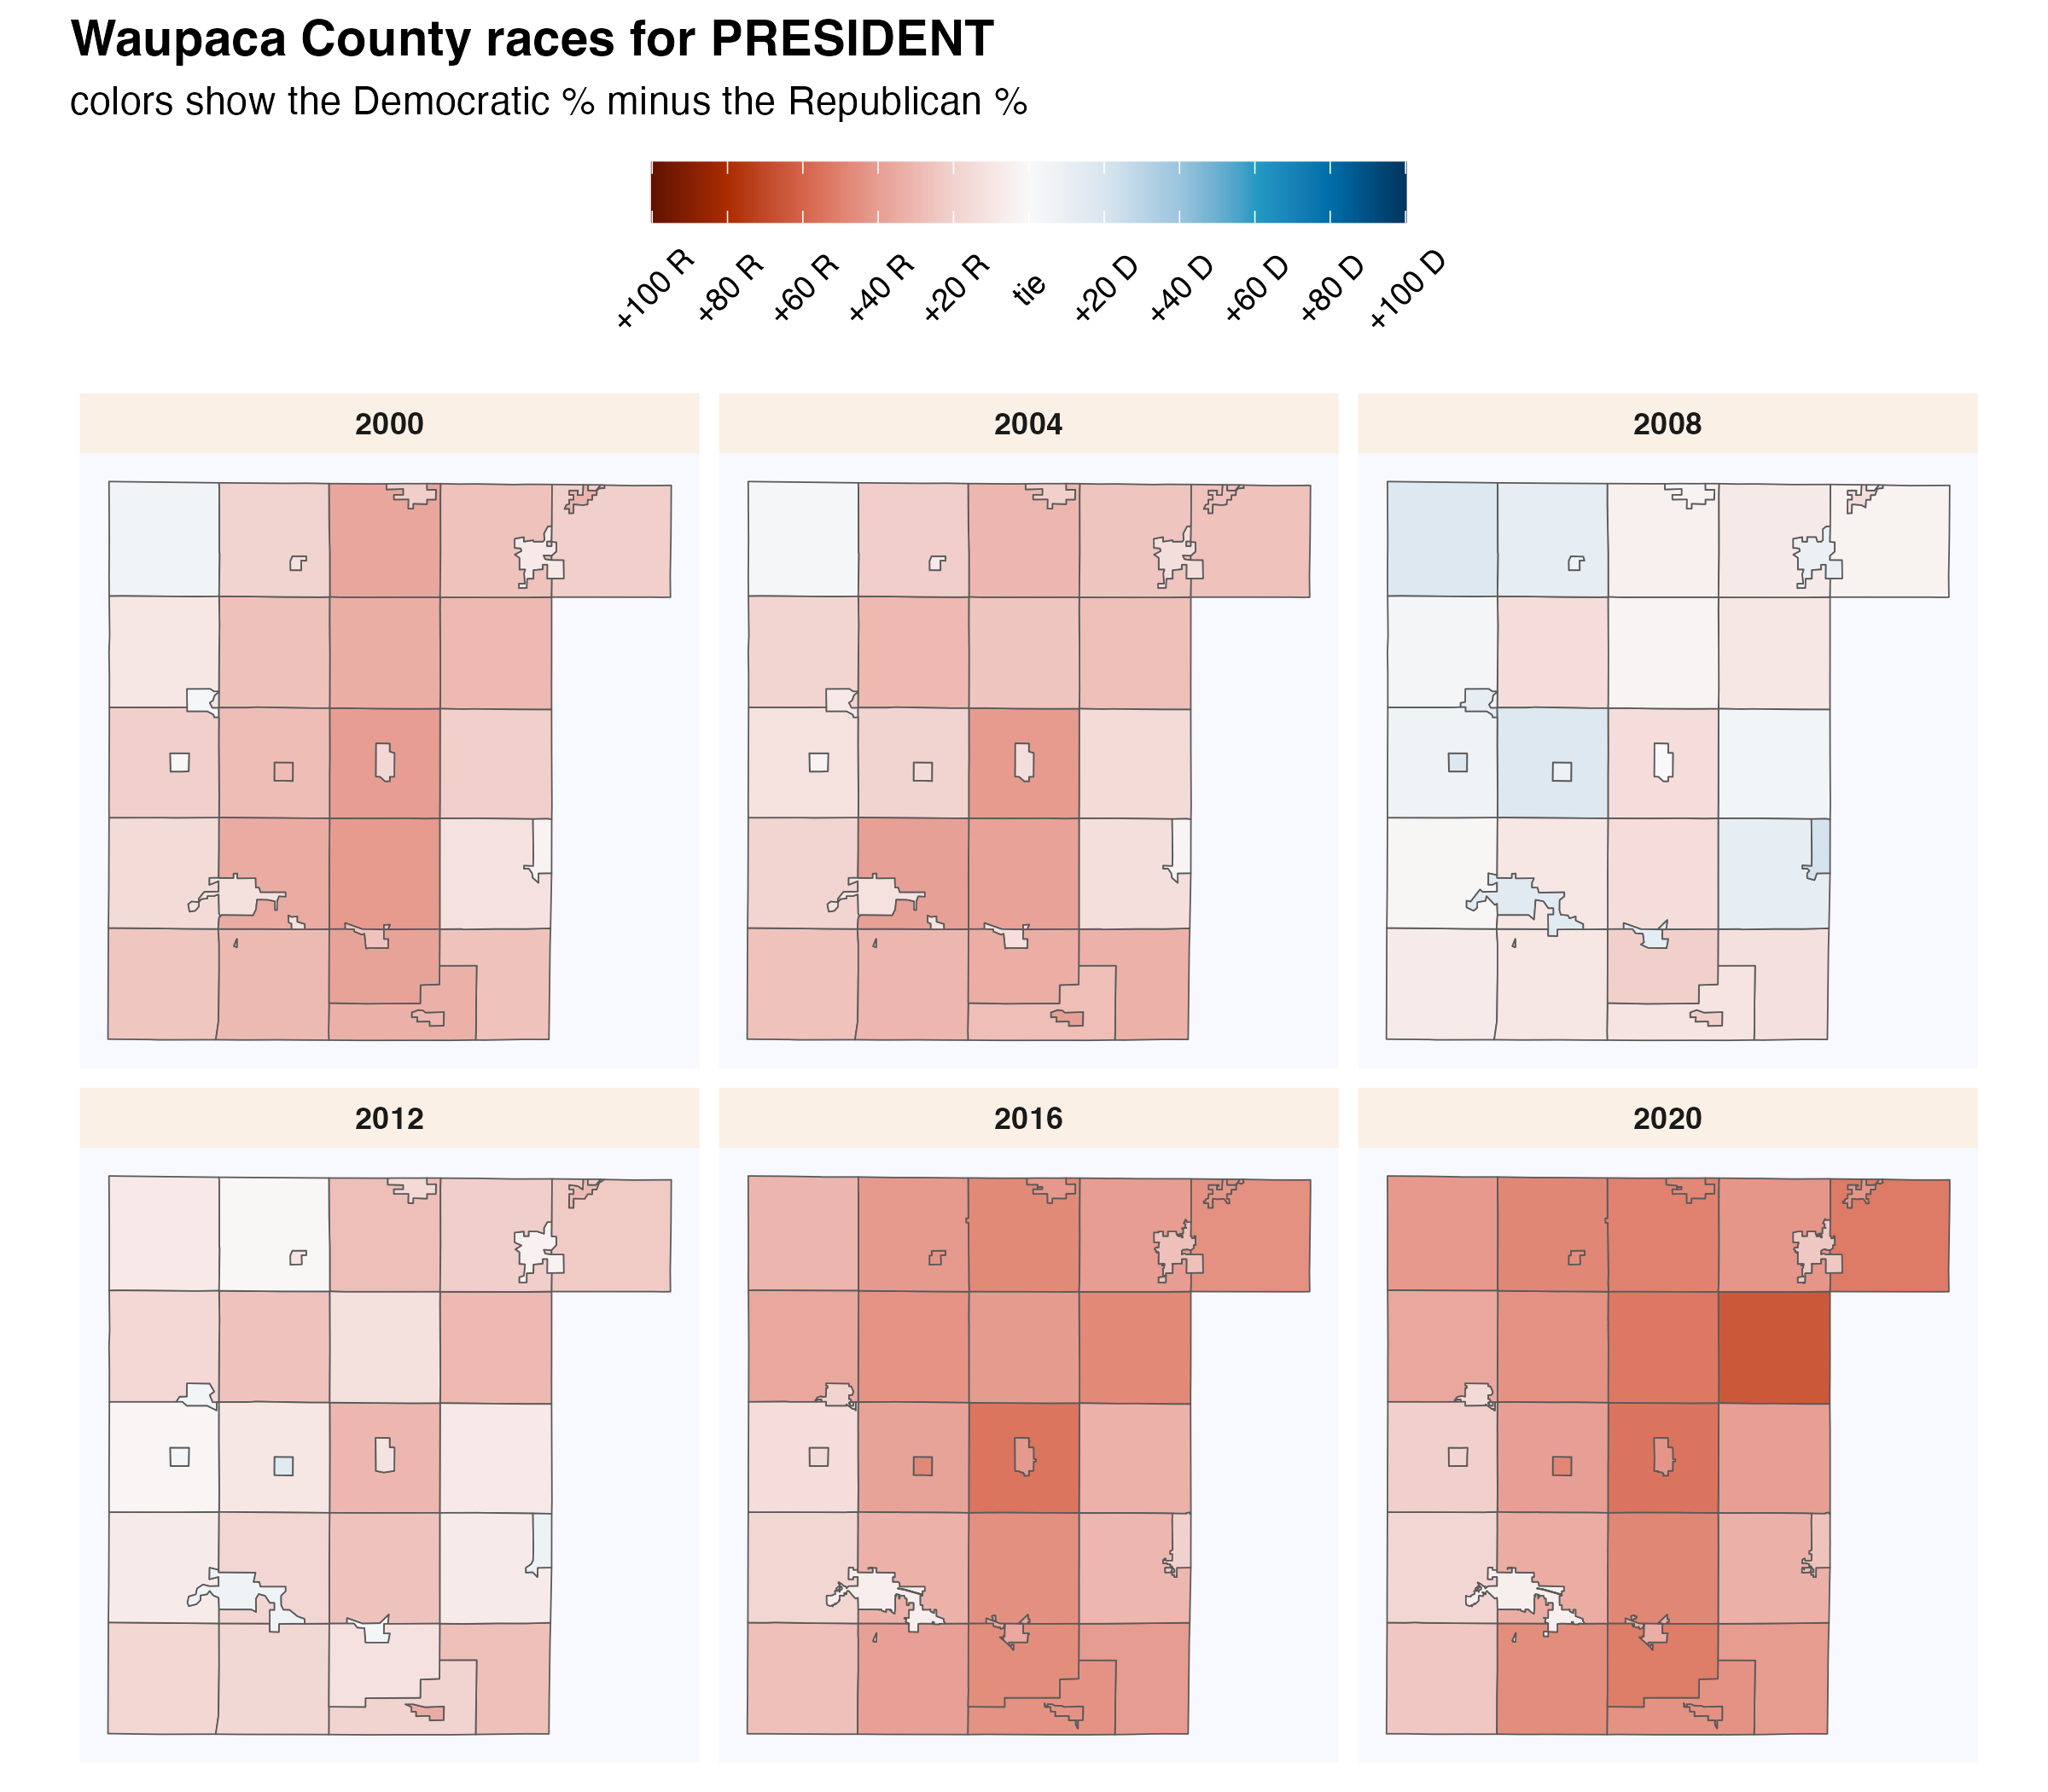
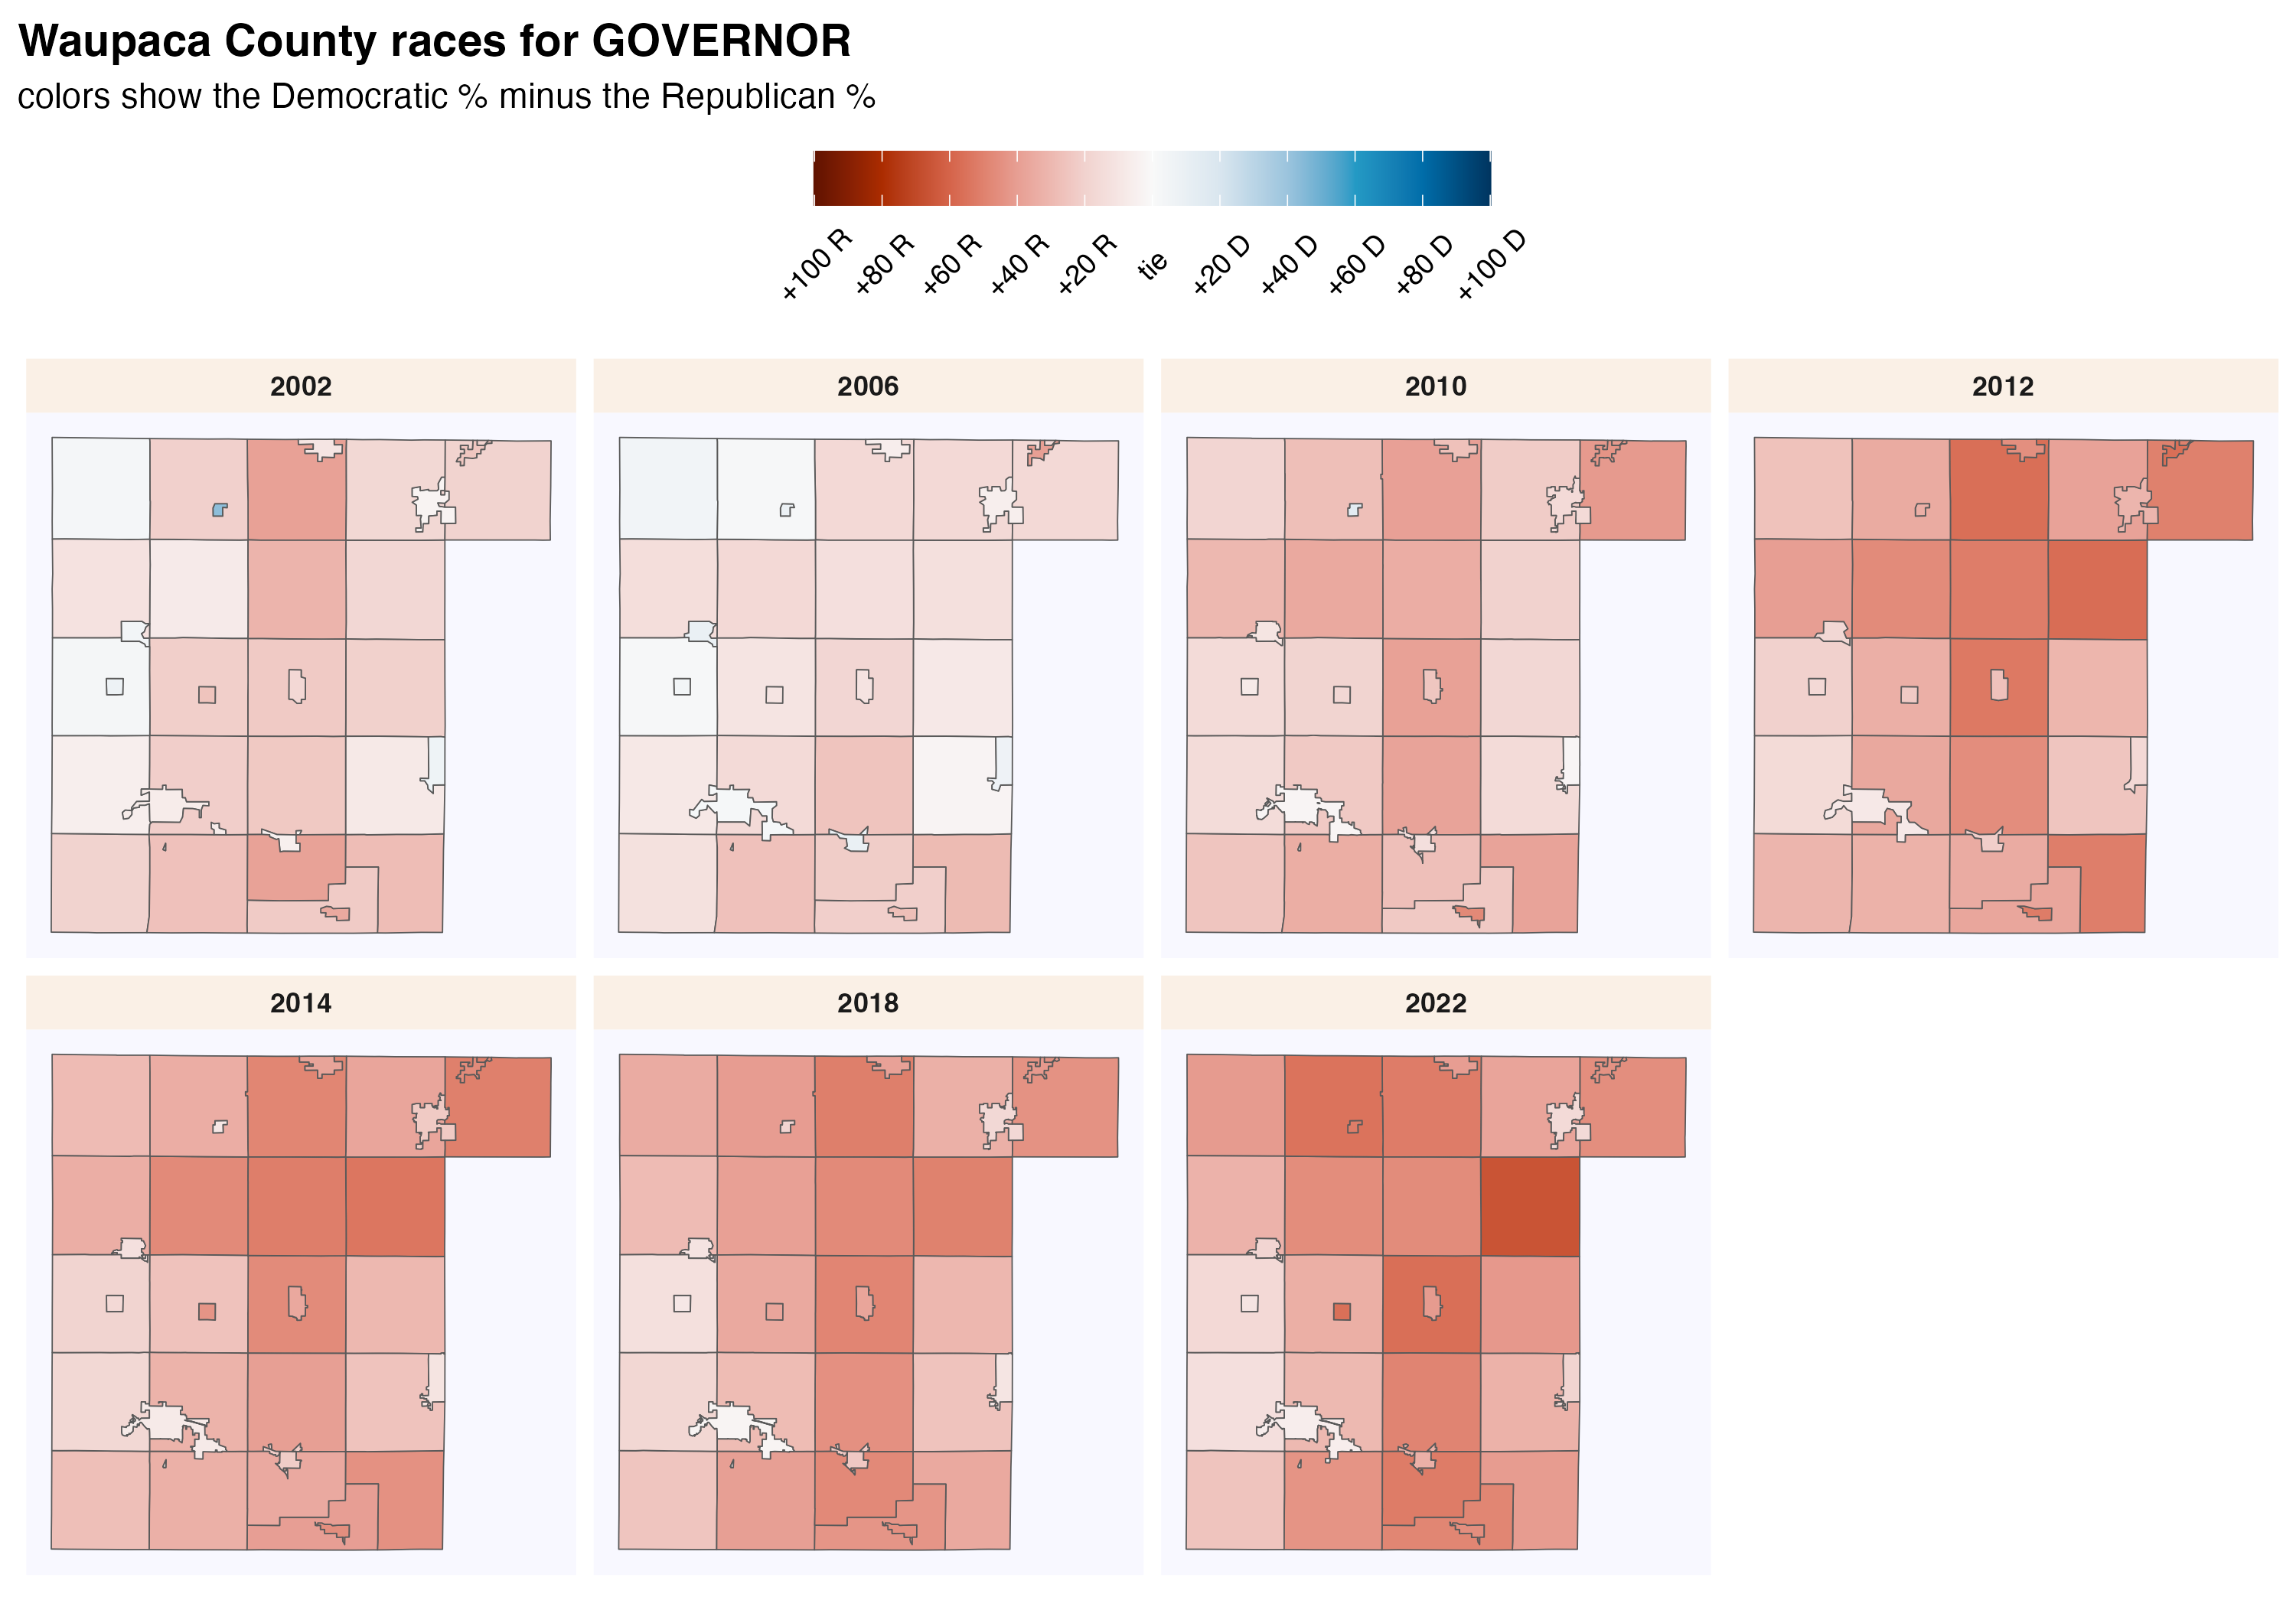
These maps show show every election result since 2000 in each municipality.
Click each column name to sort its values.
71.4 Supreme Court Election Results
Wisconsin’s Supreme Court has 7 justices, each of whom are elected to 10 year terms in statewide elections held in April. State law prohibits more than one Supreme Court election from being held in a single year. If a seat becomes vacant, the governor appoints a replacement who serves until the next year in which no court election is already scheduled. If more than two candidates achieve ballot access, a nonpartisan, top-two primary is held in February.
Court elections are formally nonpartisan, but candidates are usually supported by either liberals or conservatives. In recent years, it has become common for the Democratic and Republican parties to endorse and actively campaign on behalf of favored judicial candidates. The liberal and conservative labels indicated in the following graphs and tables are based on widely recognized tendencies, not any formal affiliation.
71.4.1 County Election Results
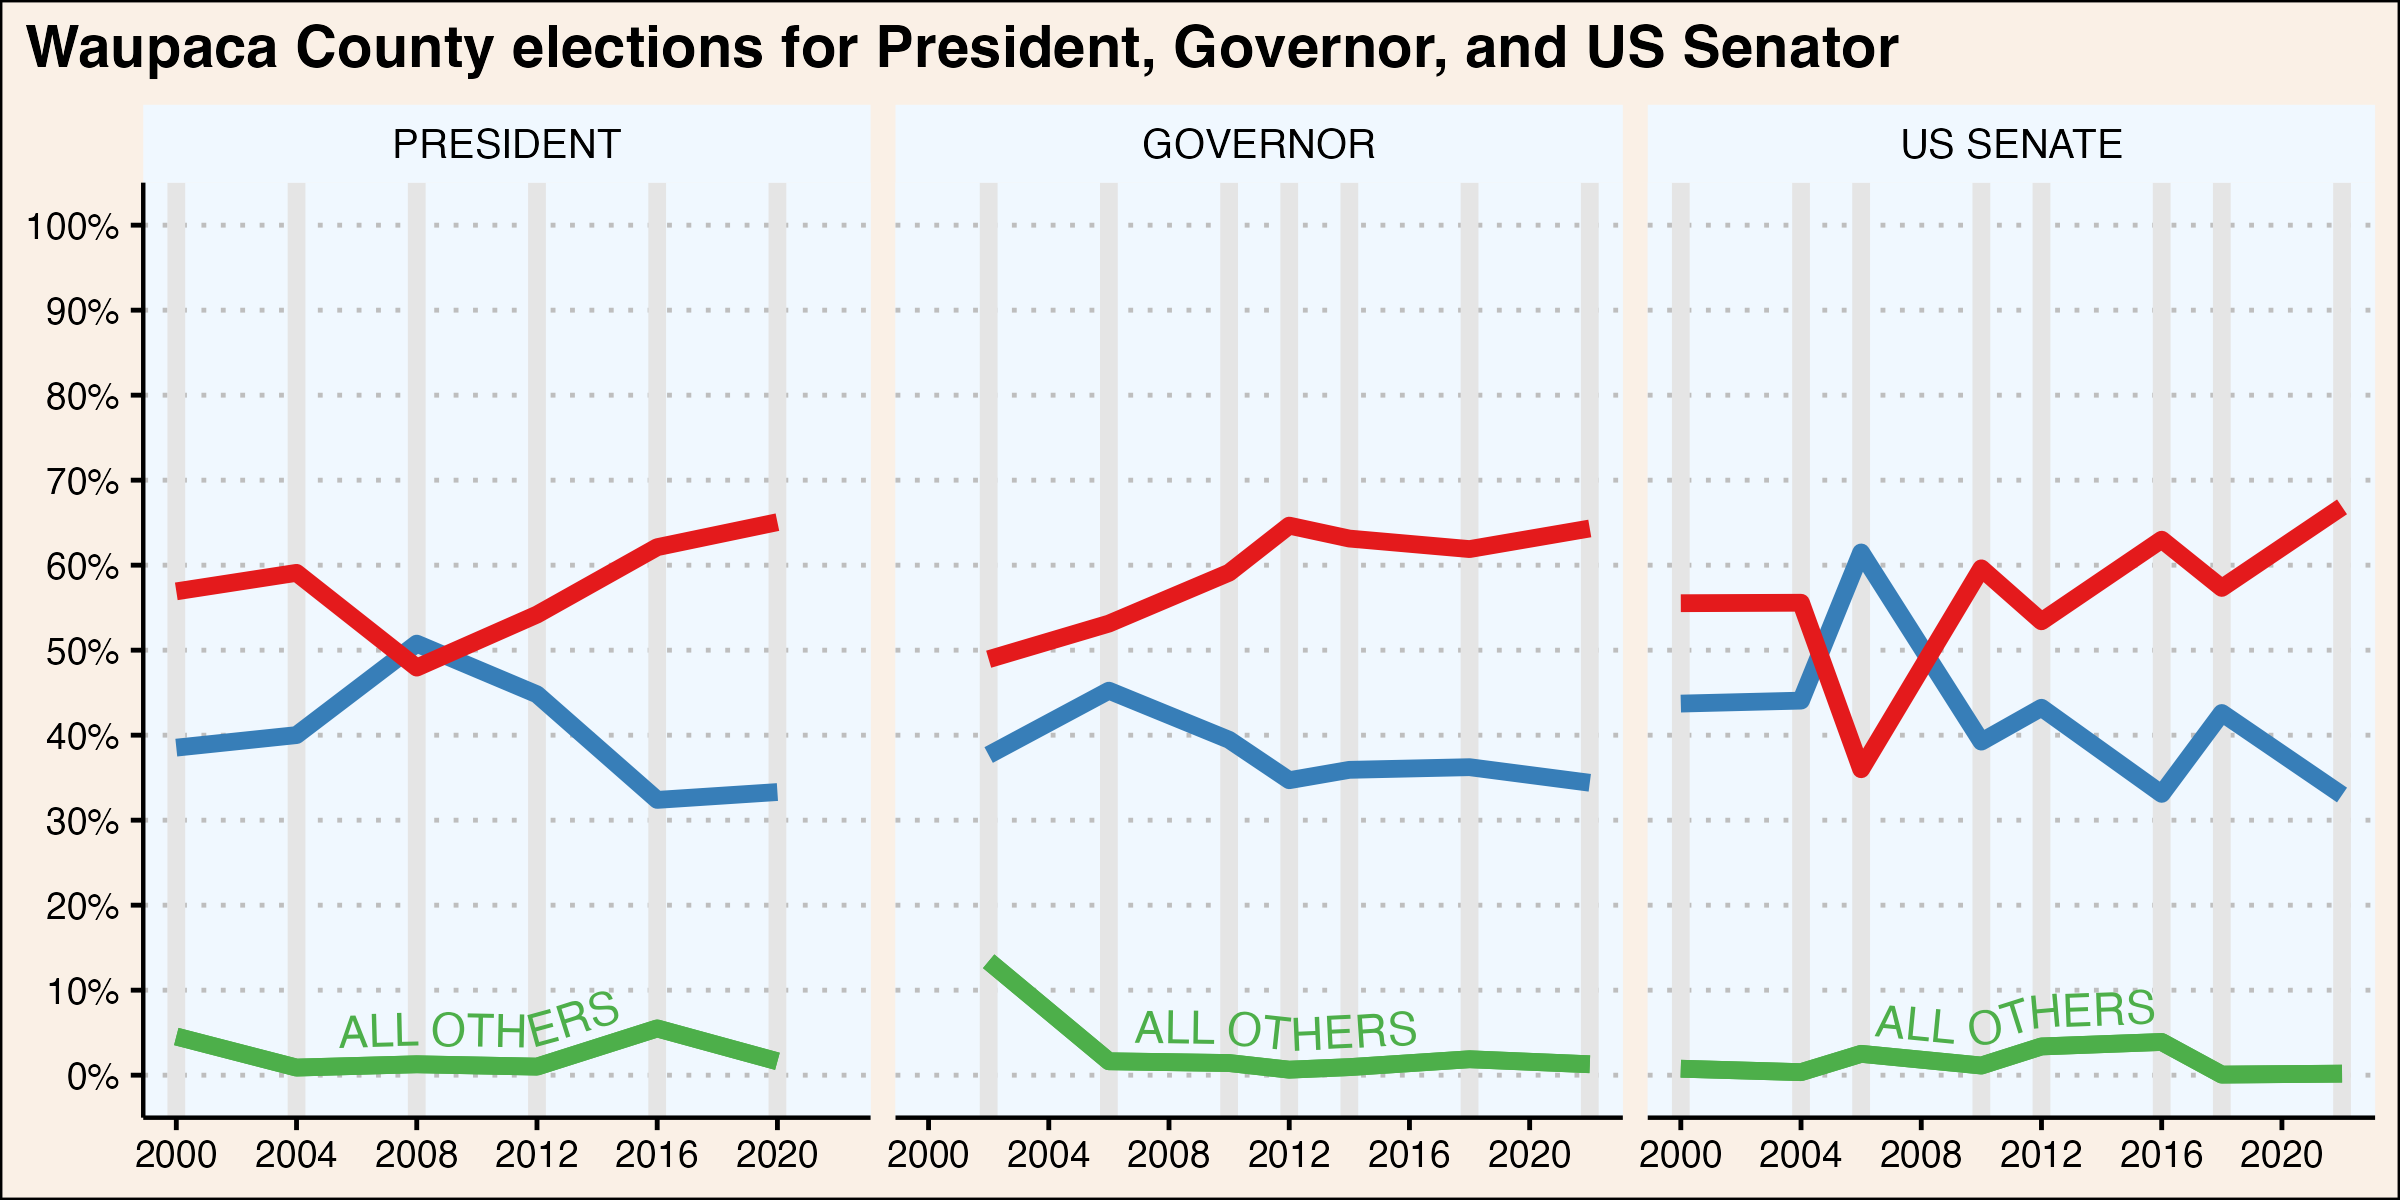
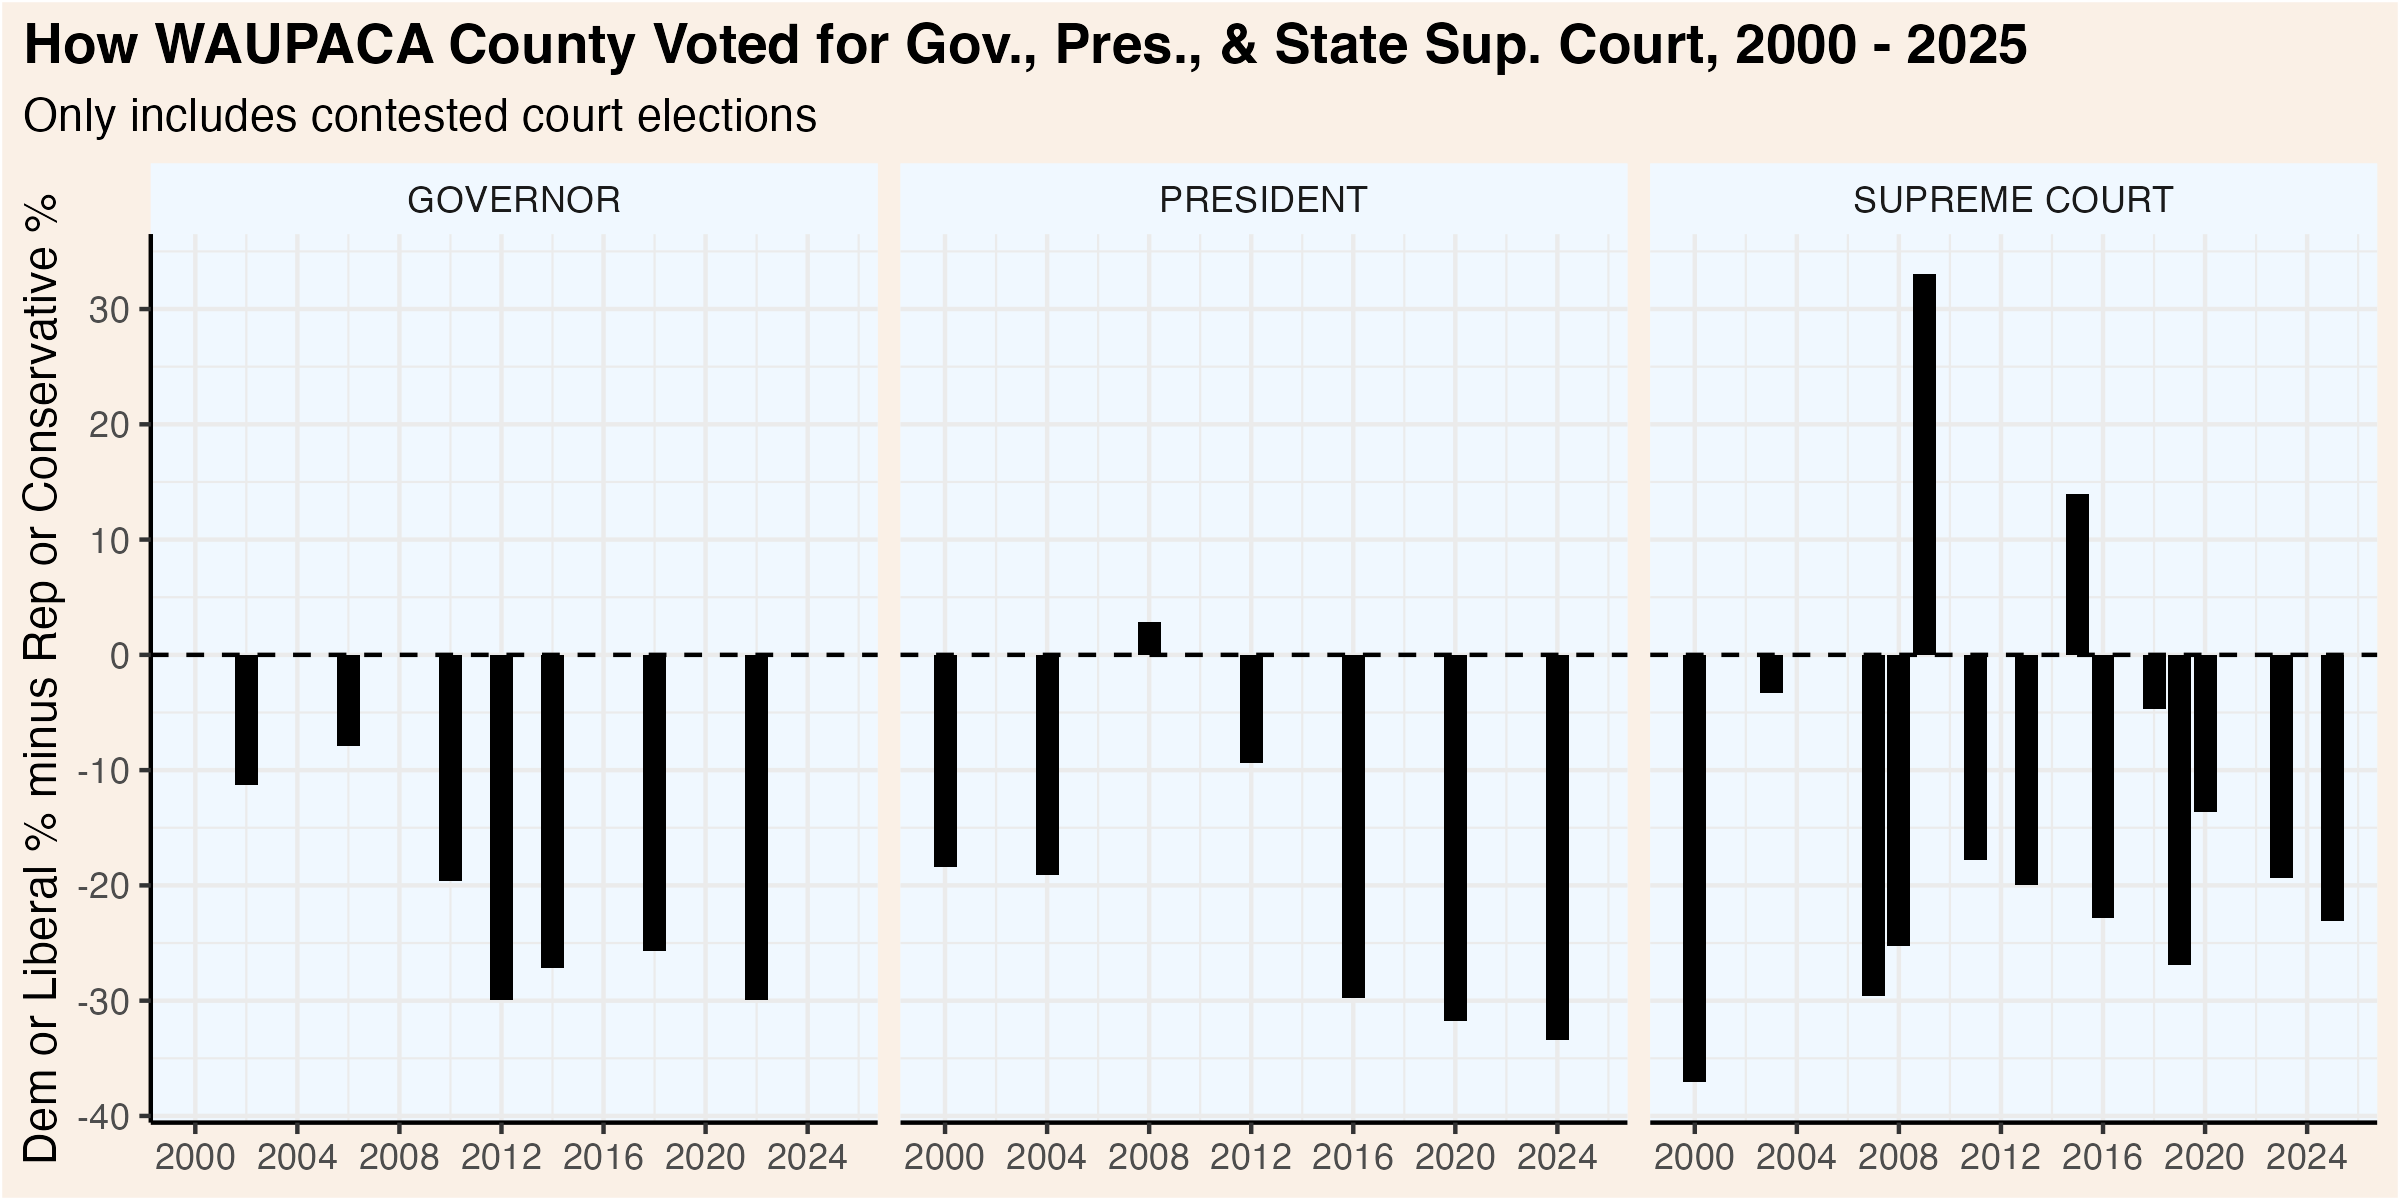
This graphic compares how presidential, gubernatorial, and court elections have trended over the past quarter century. Click the “Table” tab to see detailed results for the Supreme Court races.
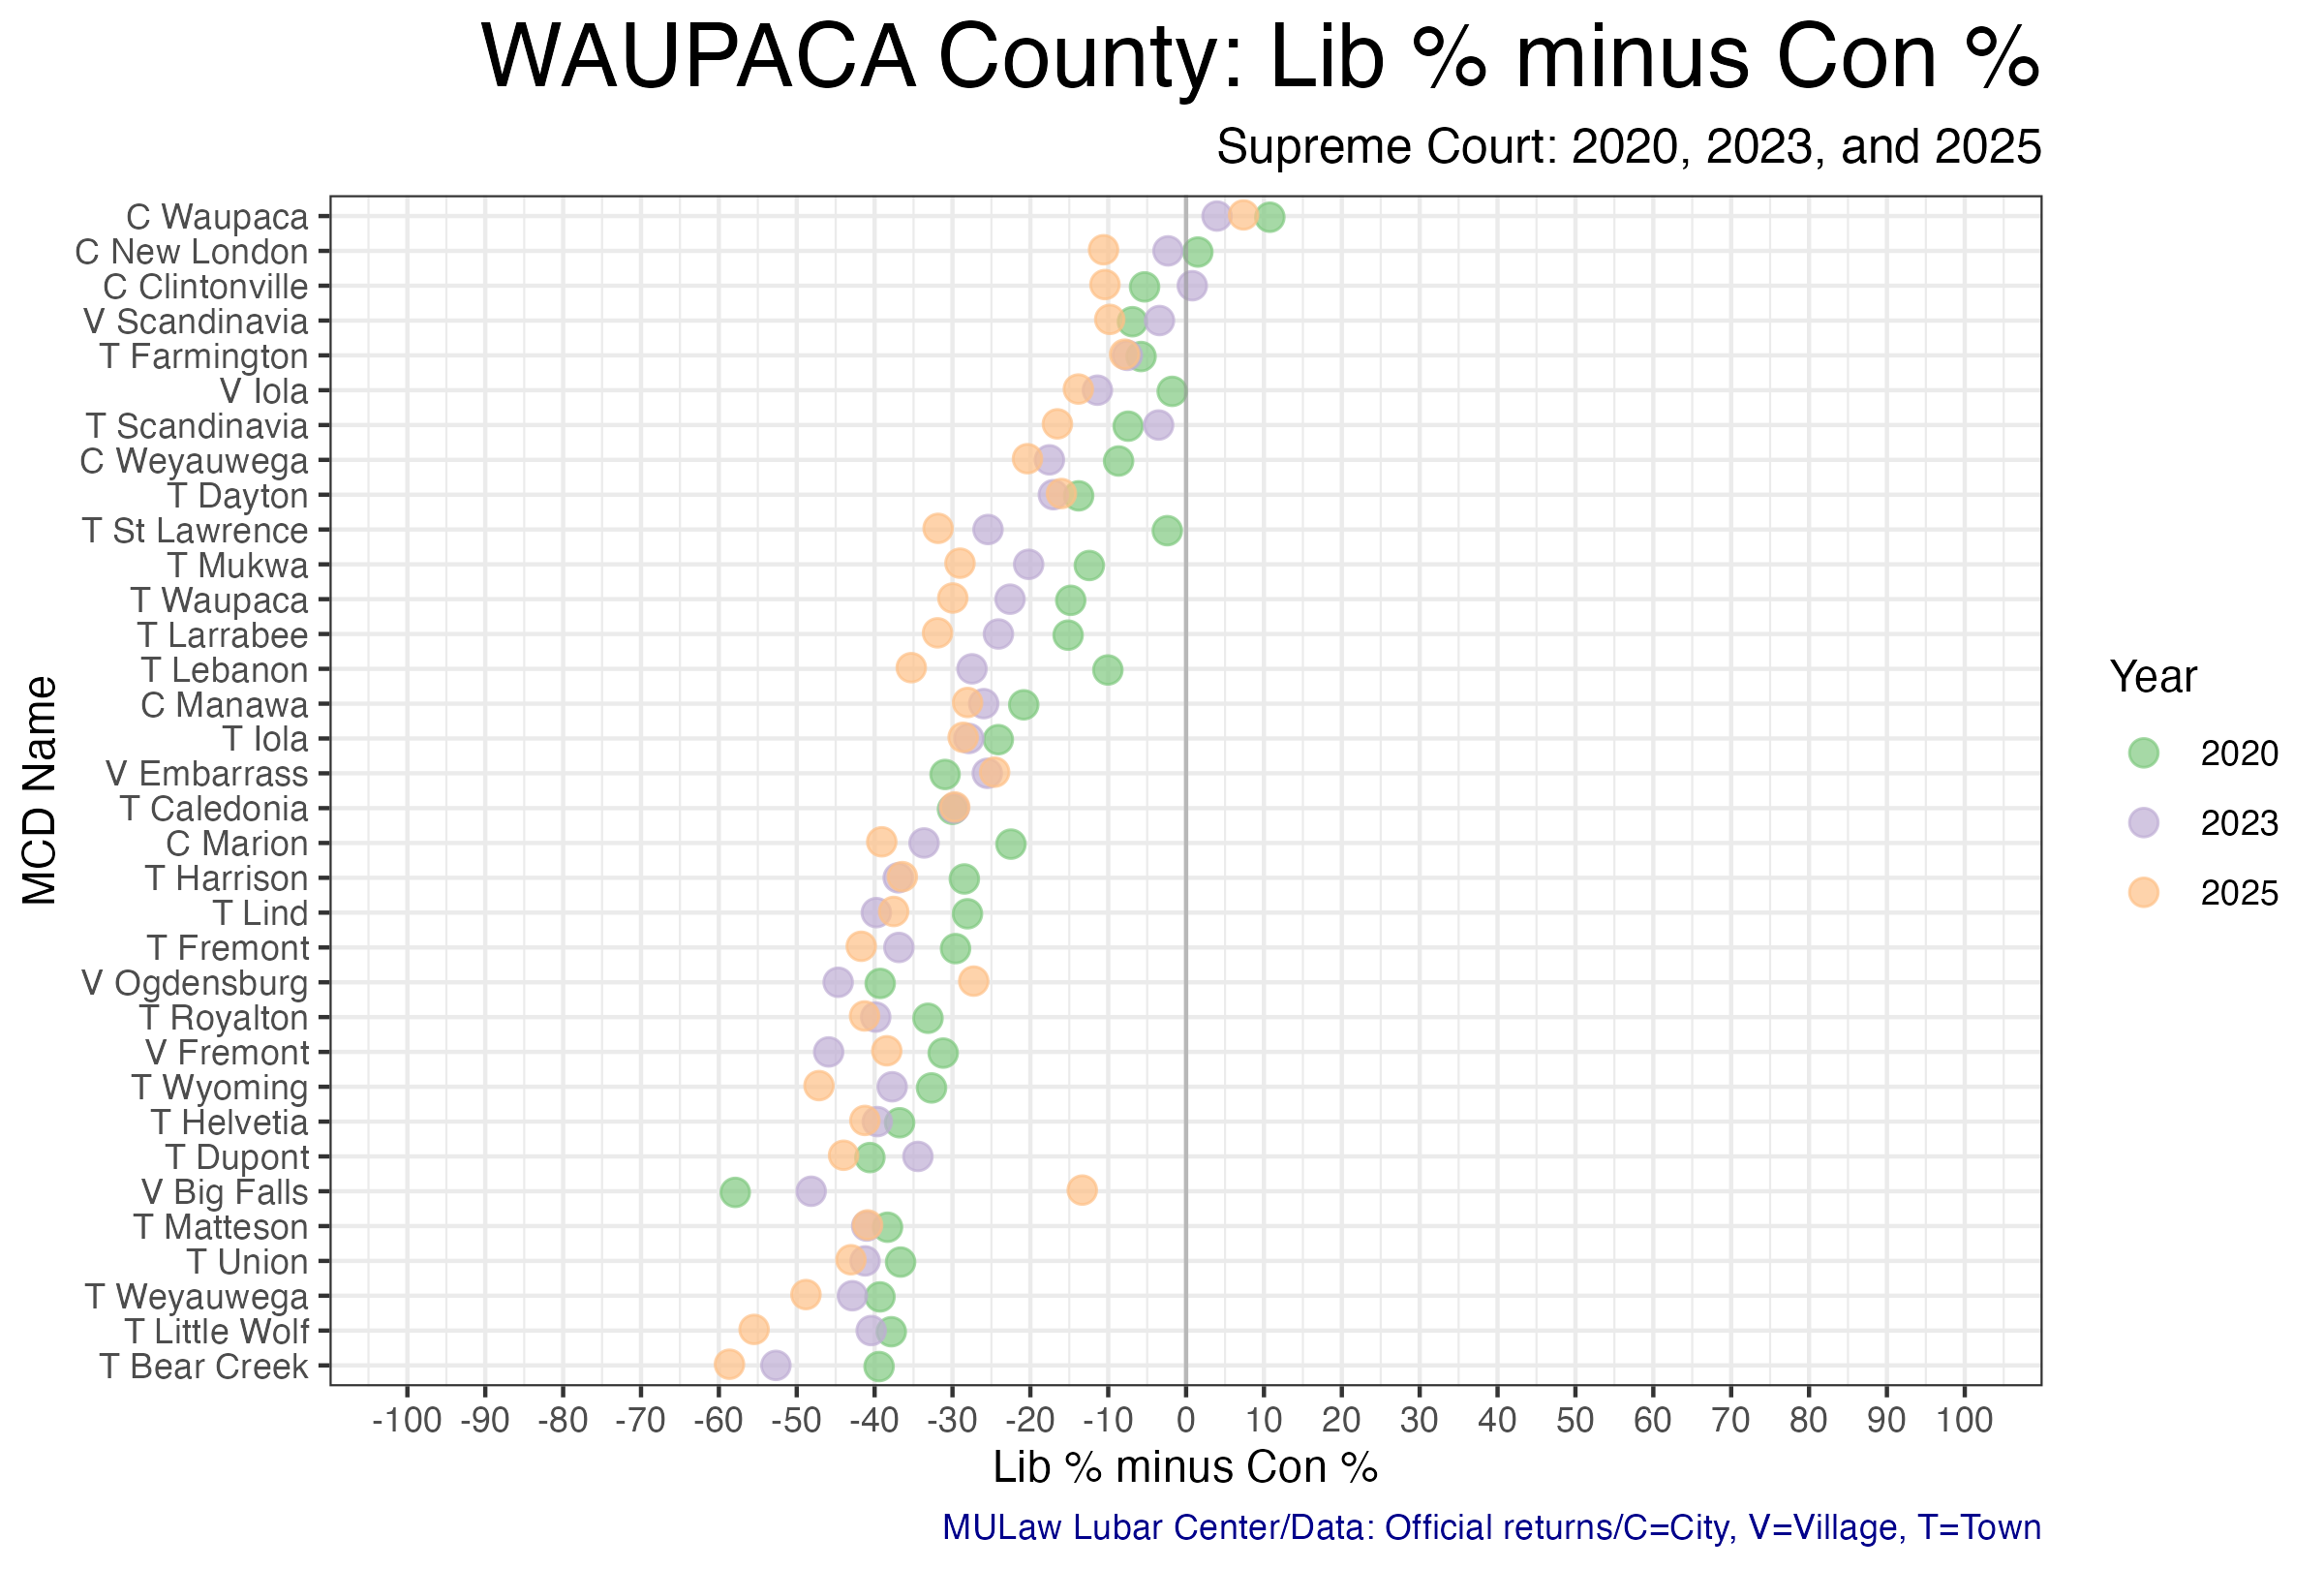
71.4.2 Municipality Election Results
The following table shows the results of each Supreme Court election by municipality. The graphic visualizes the shifts over the past three court elections.