40 Marinette
Marinette County (pop. 42,000) is located in the northeastern corner of the state, partially bordered by both Michigan’s Upper Peninsula and Lake Michigan. Its population is 94% white, with lower levels of college attendance, lower median incomes, and a higher median age than the state average. Politically, the county was fairly competitive in the early 2000s but has since become strongly Republican-leaning.
40.1 Demographics

40.2 County Election Results

Click each column name to sort its values.
40.3 Municipality Election Results
Marinette City is the largest and most politically competitive community in Marinette County, where all municipalities typically vote for the Republican candidate. The county also includes the City of Peshtigo, where one of the most deadly wildfires in American history occurred in 1871.
This map shows the location of each municipality in the county, as it existed in 2022.

These dot plots show the most recent election results in each municipality.


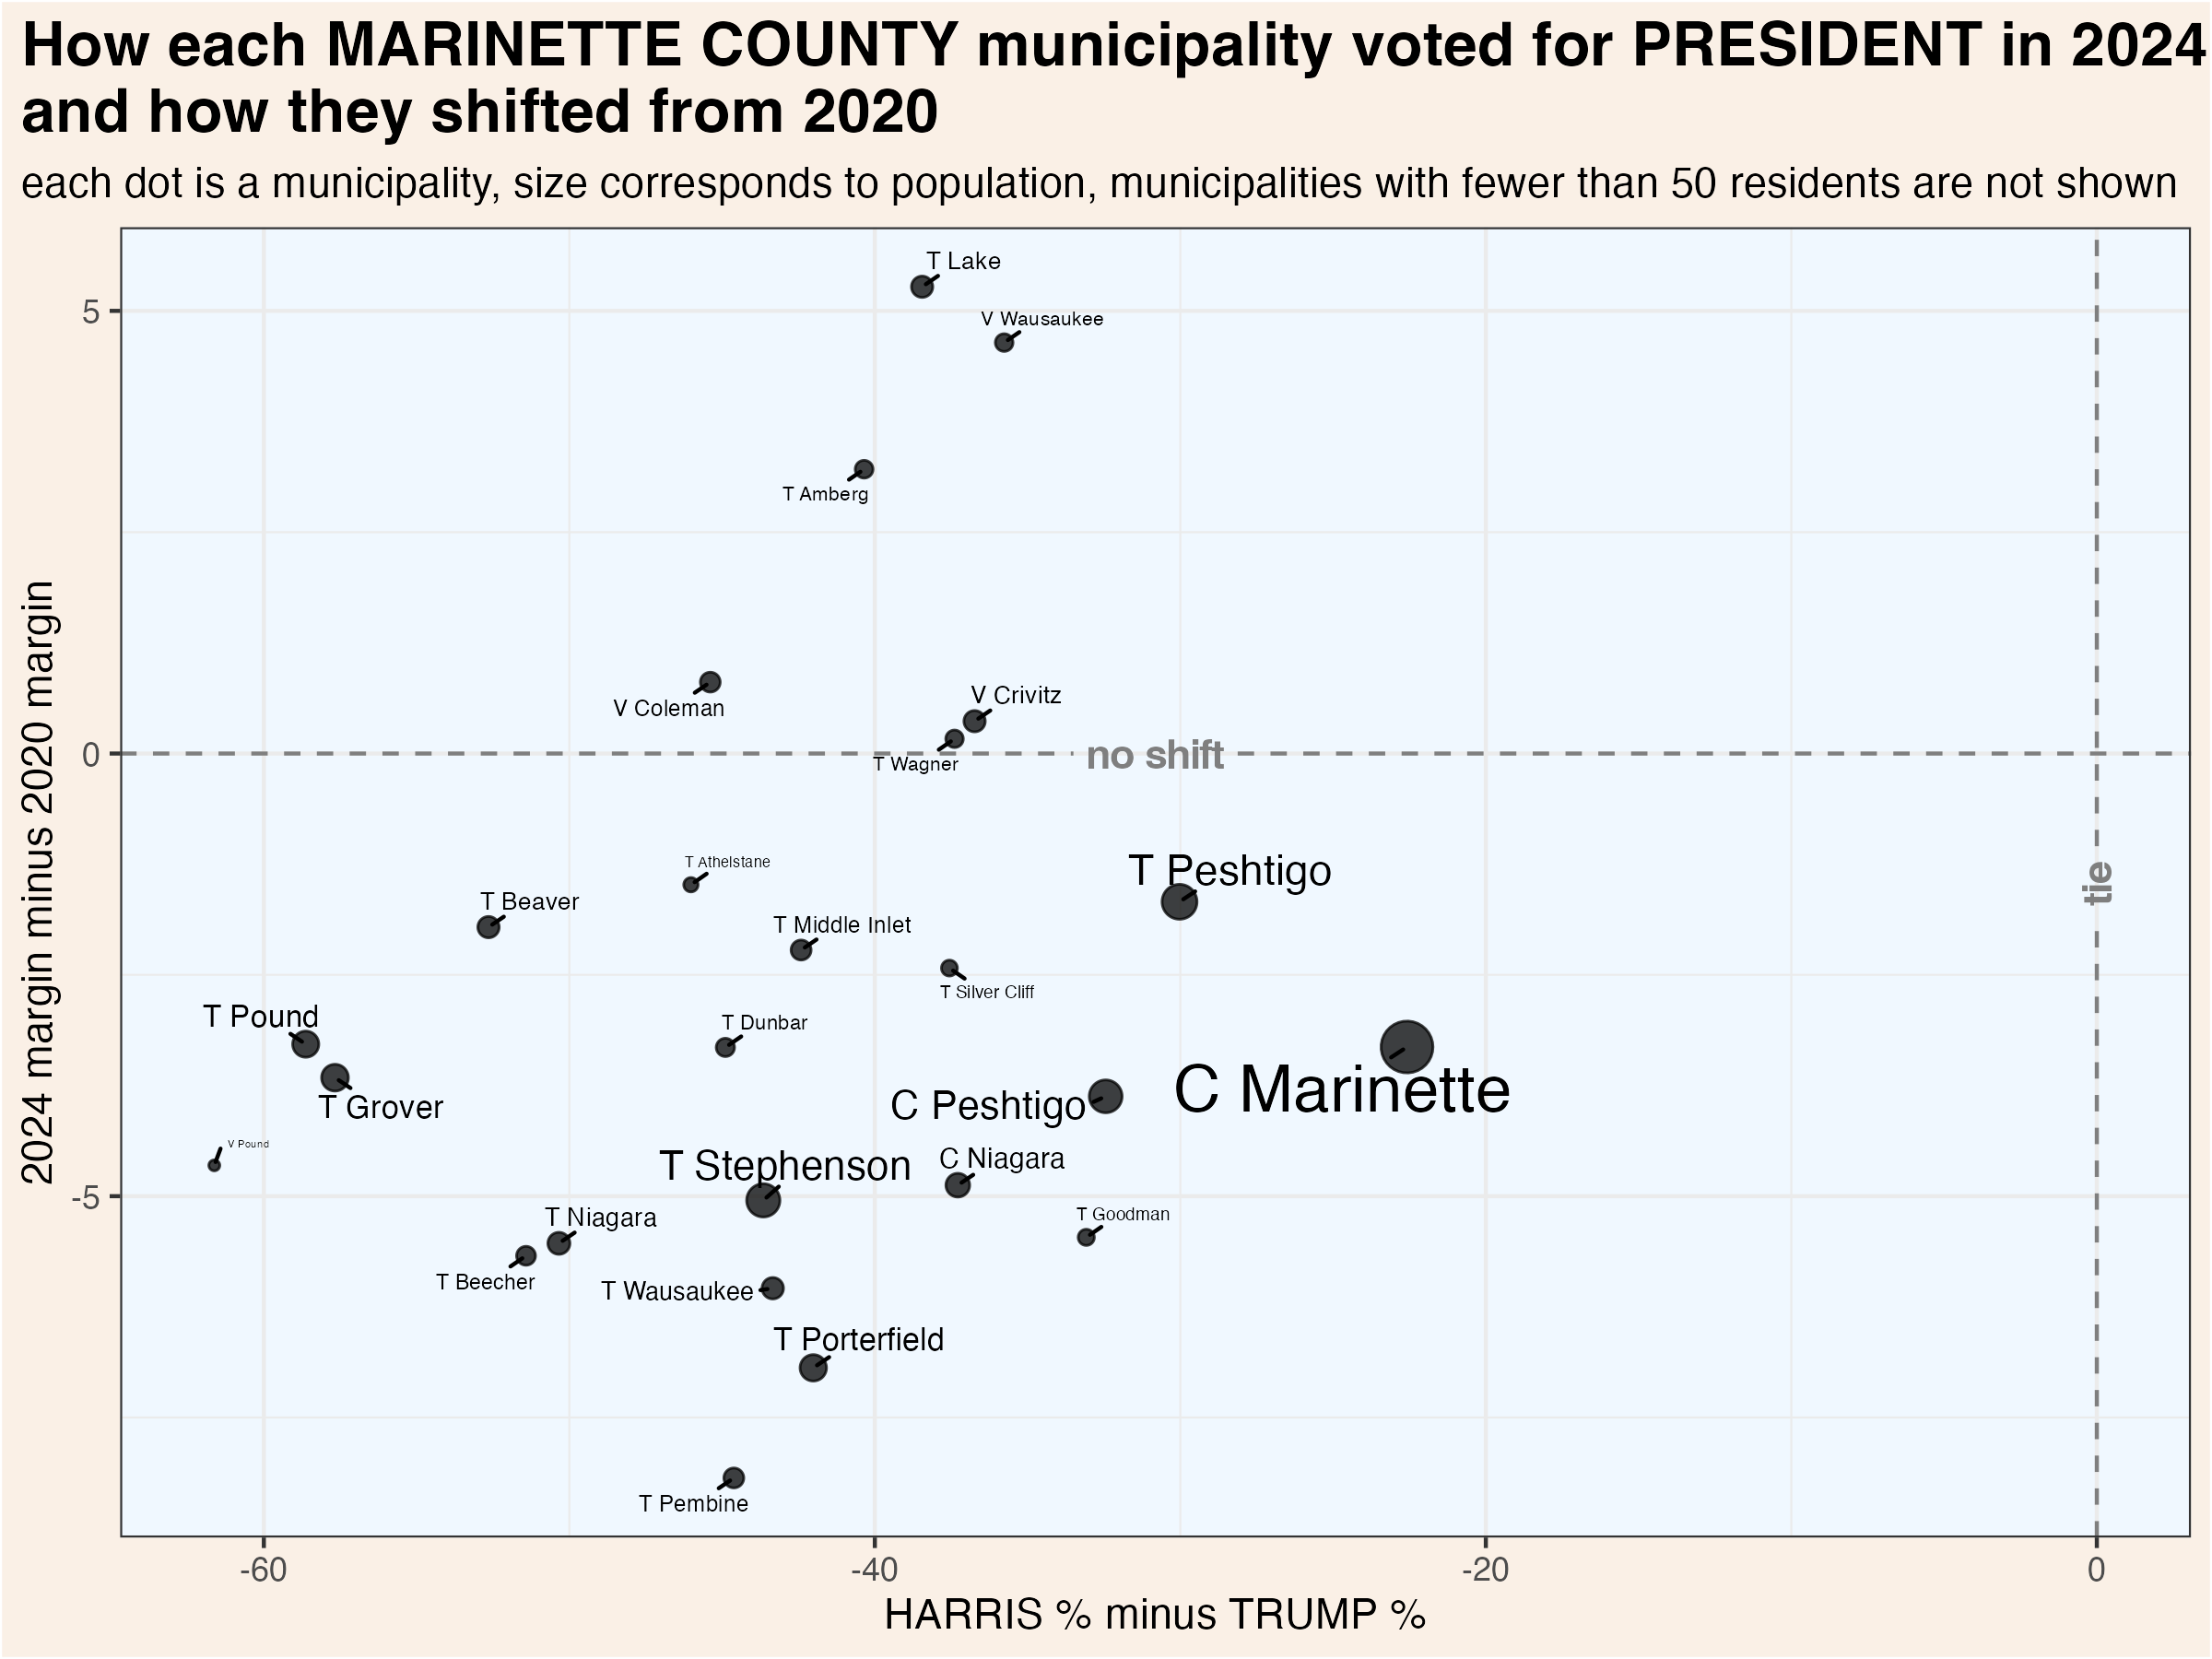
To more clearly illustrate recent changes in municipality voting trends, these scatterplots compare the most recent vote for president and senator with the shift from that office’s previous election.

These maps show show every election result since 2000 in each municipality.


Click each column name to sort its values.
40.4 Supreme Court Election Results
Wisconsin’s Supreme Court has 7 justices, each of whom are elected to 10 year terms in statewide elections held in April. State law prohibits more than one Supreme Court election from being held in a single year. If a seat becomes vacant, the governor appoints a replacement who serves until the next year in which no court election is already scheduled. If more than two candidates achieve ballot access, a nonpartisan, top-two primary is held in February.
Court elections are formally nonpartisan, but candidates are usually supported by either liberals or conservatives. In recent years, it has become common for the Democratic and Republican parties to endorse and actively campaign on behalf of favored judicial candidates. The liberal and conservative labels indicated in the following graphs and tables are based on widely recognized tendencies, not any formal affiliation.
40.4.1 County Election Results
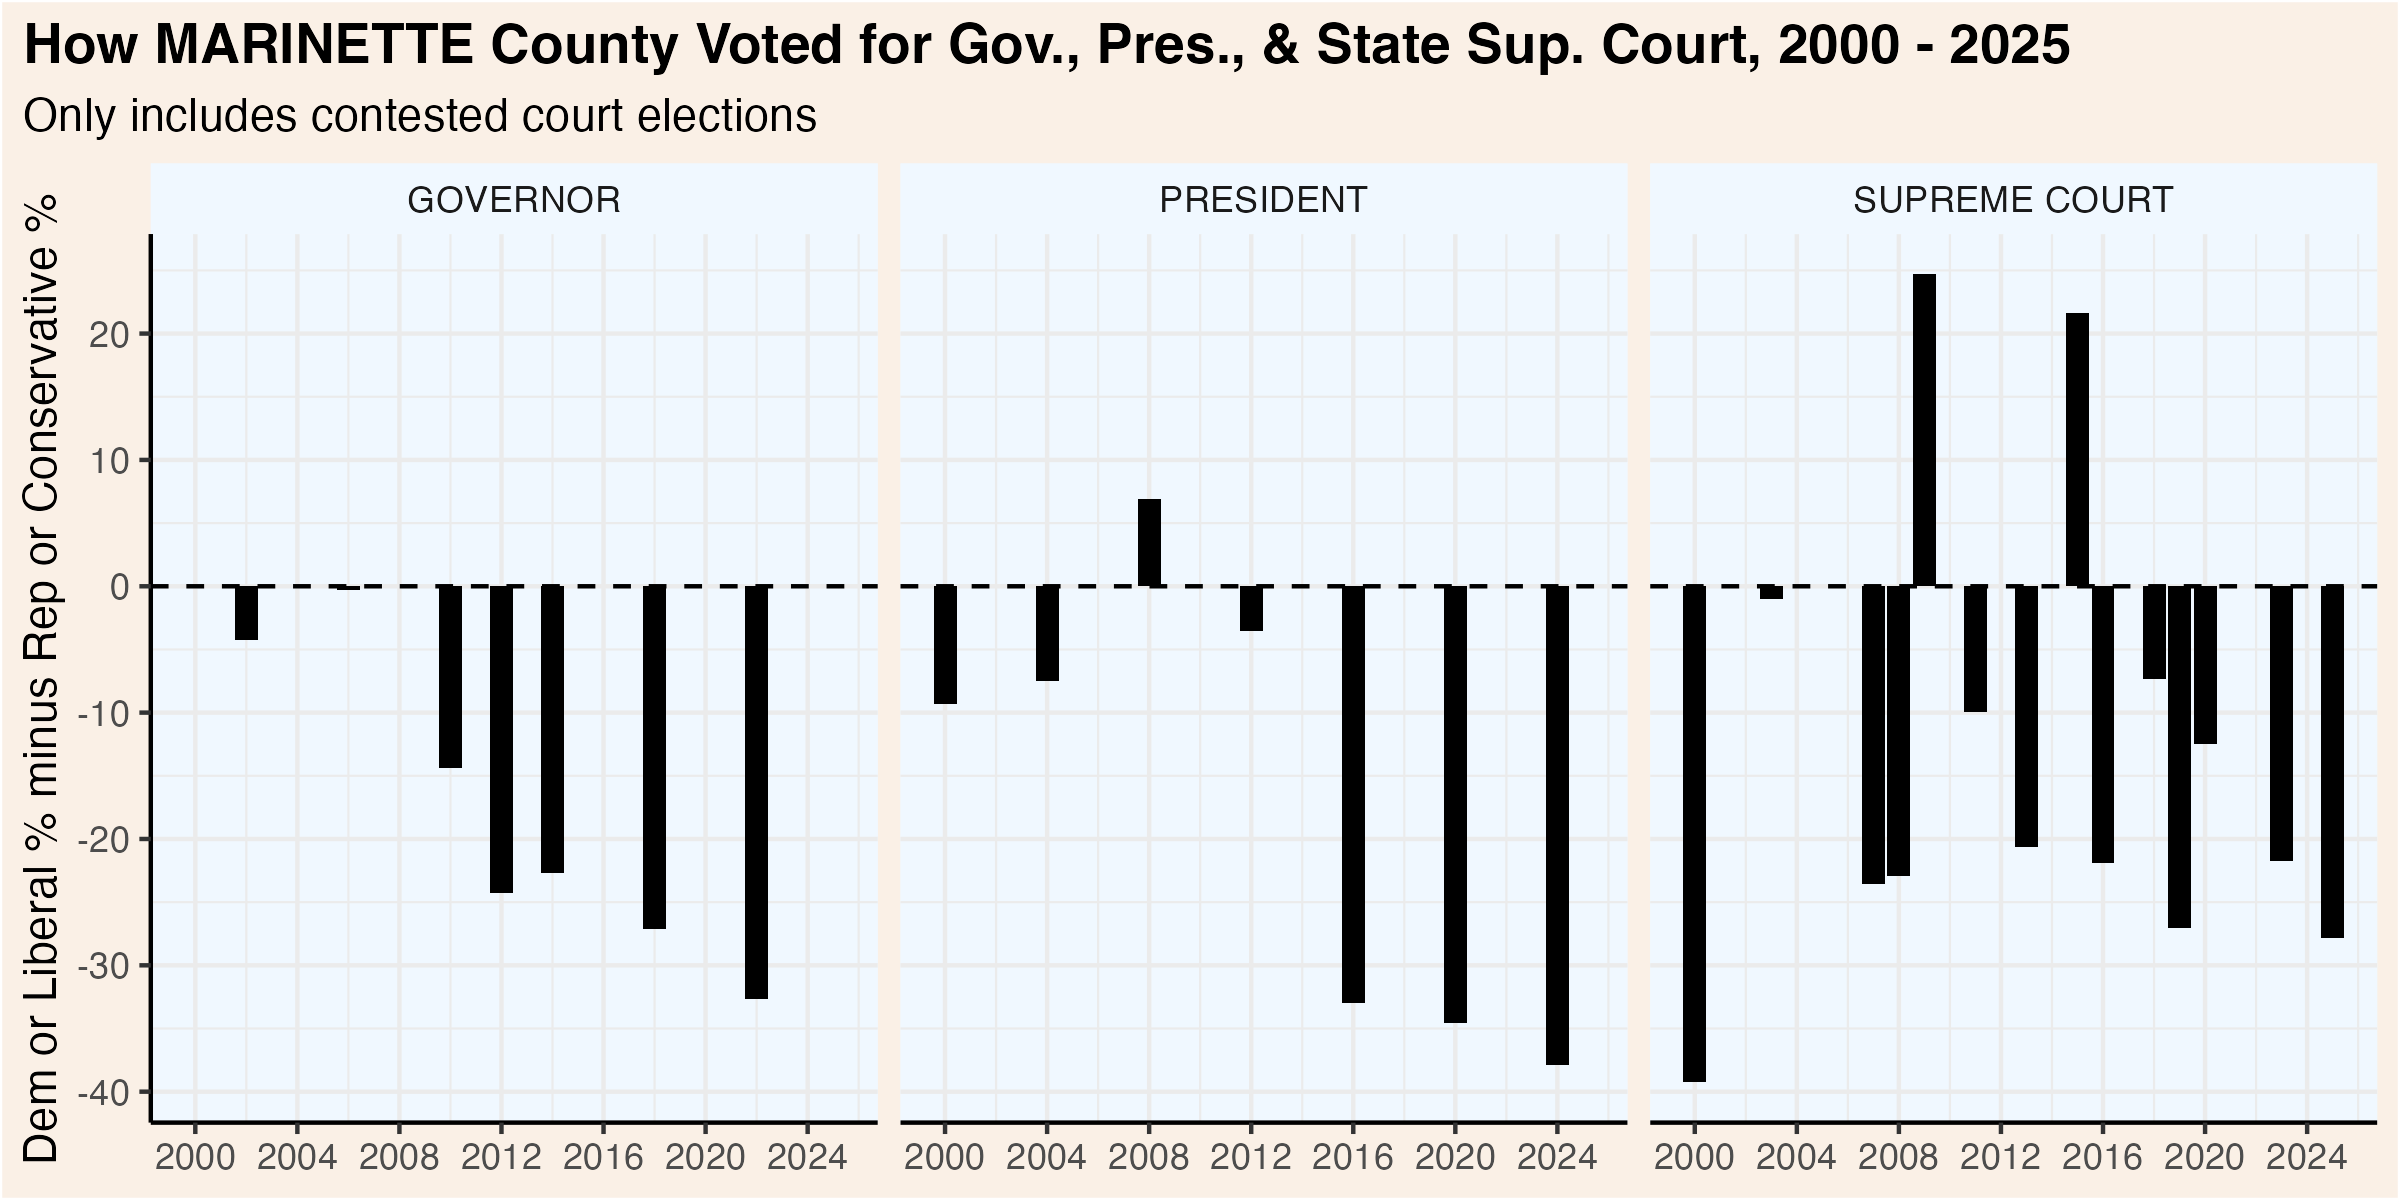
This graphic compares how presidential, gubernatorial, and court elections have trended over the past quarter century. Click the “Table” tab to see detailed results for the Supreme Court races.
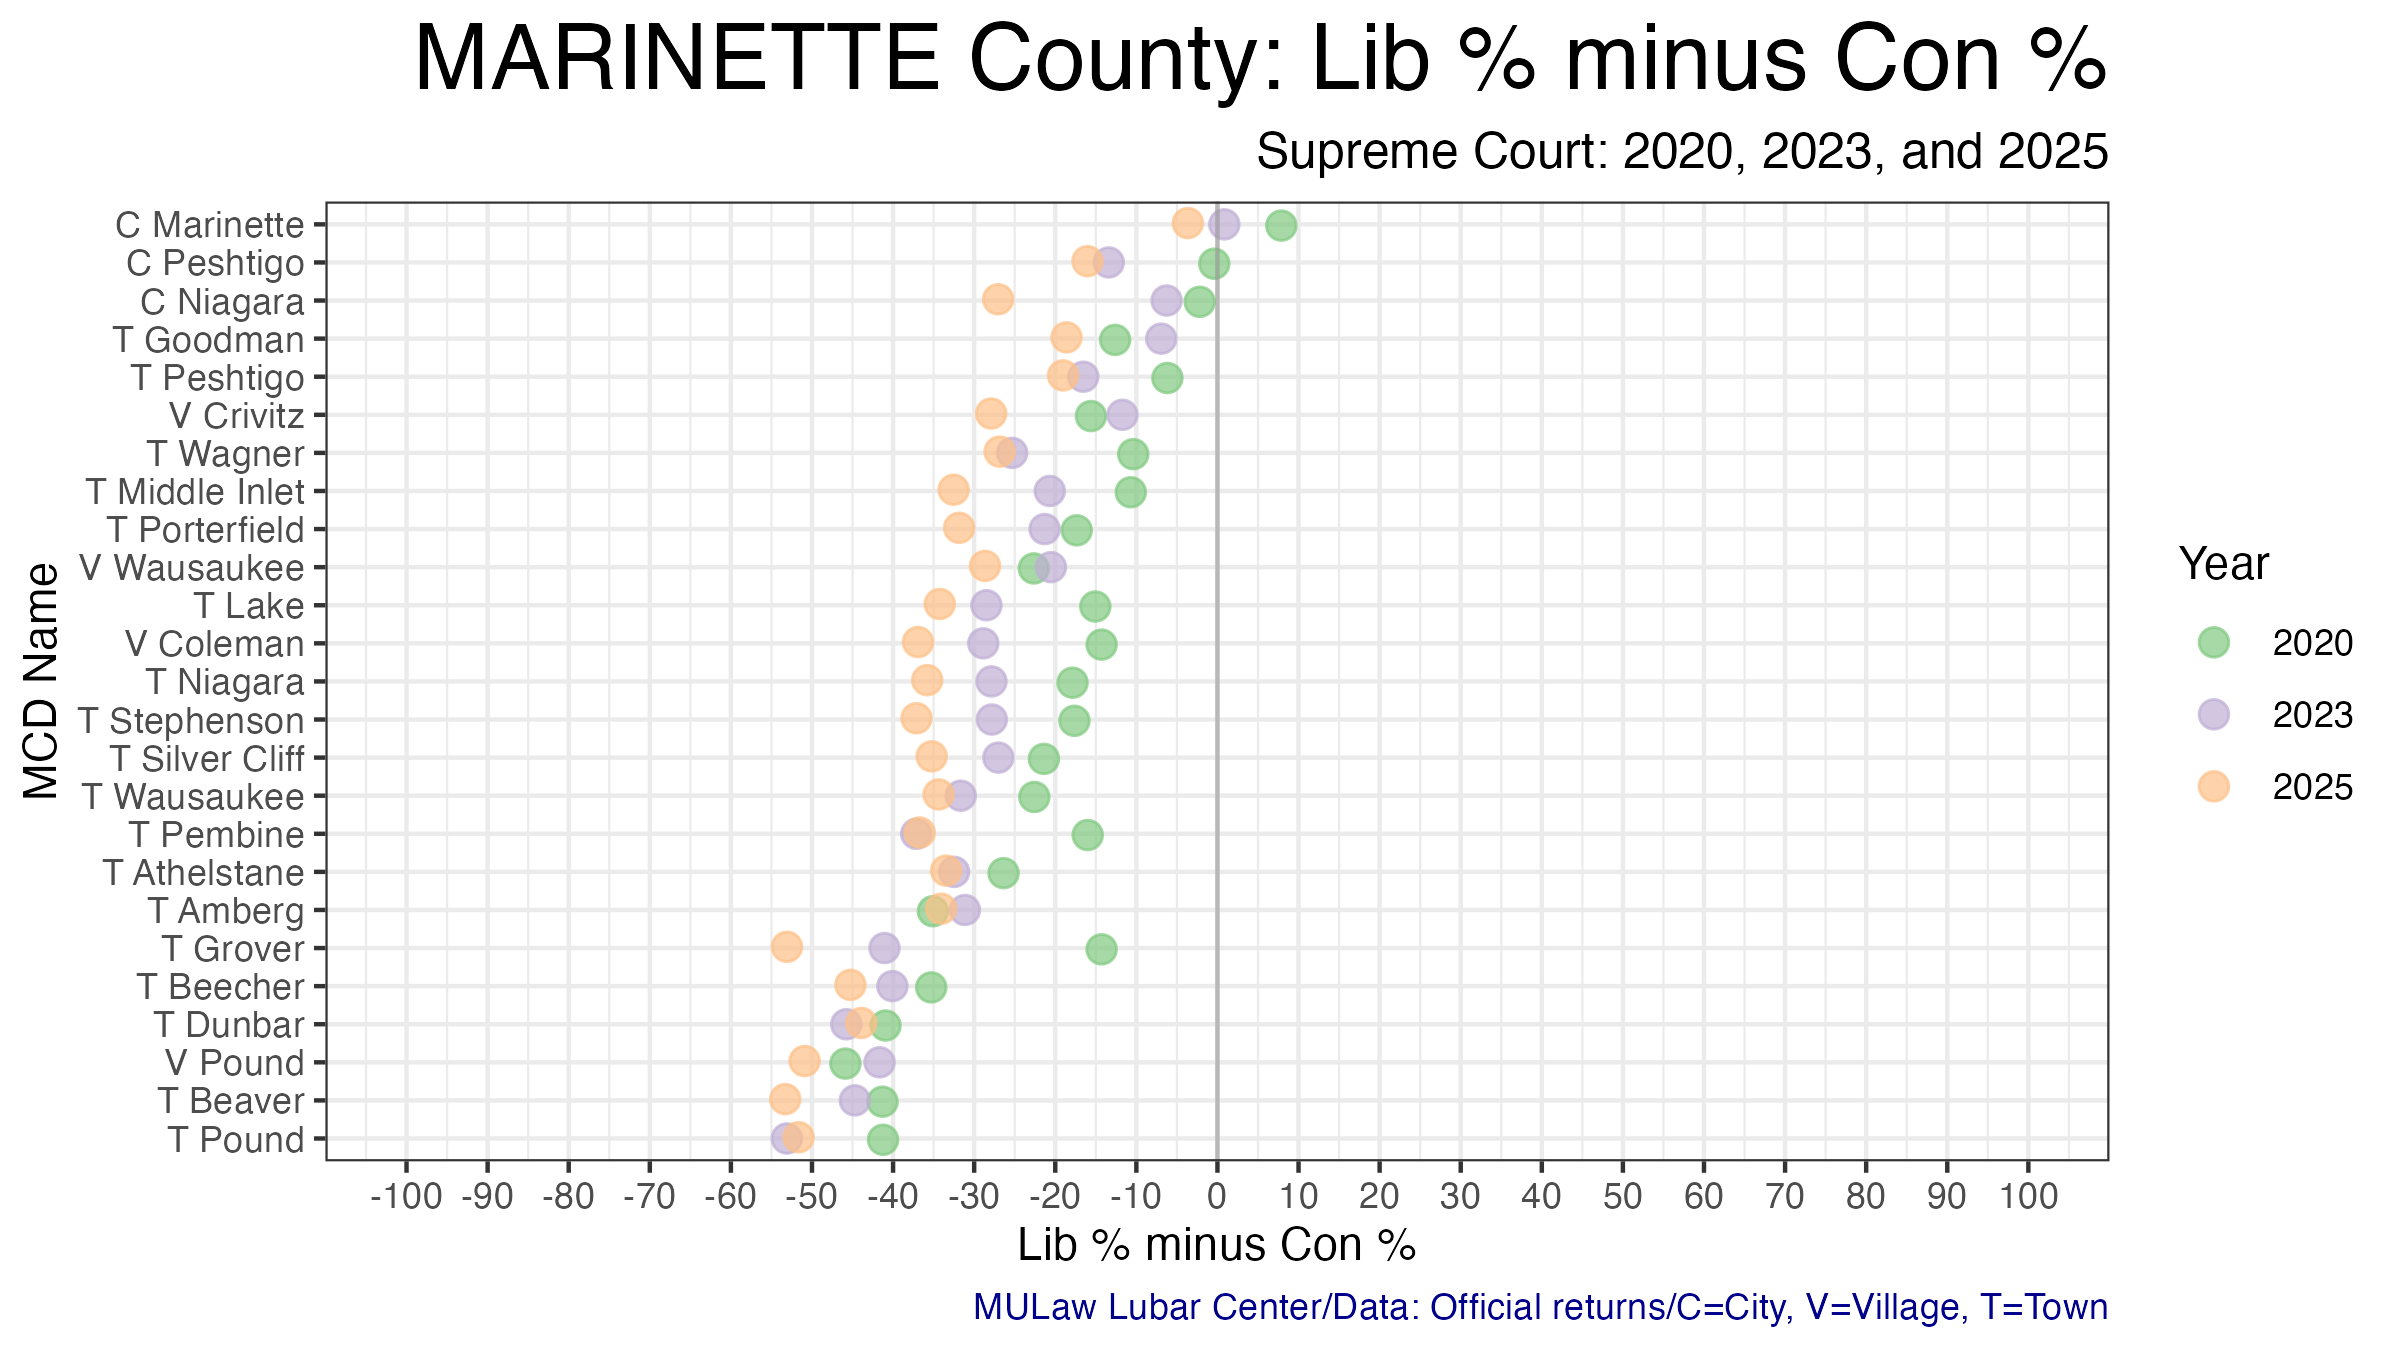
40.4.2 Municipality Election Results
The following table shows the results of each Supreme Court election by municipality. The graphic visualizes the shifts over the past three court elections.