65 Vernon
Vernon County (pop. 31,000) is located in the Driftless Area of southwestern Wisconsin. Its population is 95% white, with lower college attendance than the state average. Incomes are also somewhat lower and poverty rates are higher. Politically, the county is very competitive. Donald Trump won the county in 2016, 2020, and 2024. However, the Democratic candidate won the governor’s race in 2014, 2018, and 2022.
65.1 Demographics

65.2 County Election Results

Click each column name to sort its values.
65.3 Municipality Election Results
Vernon County’s population is spread across many small communities. The largest, Viroqua city, has about 4,500 residents, or about 15% of the county’s total. Viroqua is also the most Democratic-leaning community. It gave a higher share of support to the Democratic candidate in each of the last 3 gubernatorial races. Some other communities also typically lean Democratic, while many of the more rural towns consistently support Republicans. Other places, like the City of Hillsboro, are themselves quite competitive.
This map shows the location of each municipality in the county, as it existed in 2022.

These dot plots show the most recent election results in each municipality.


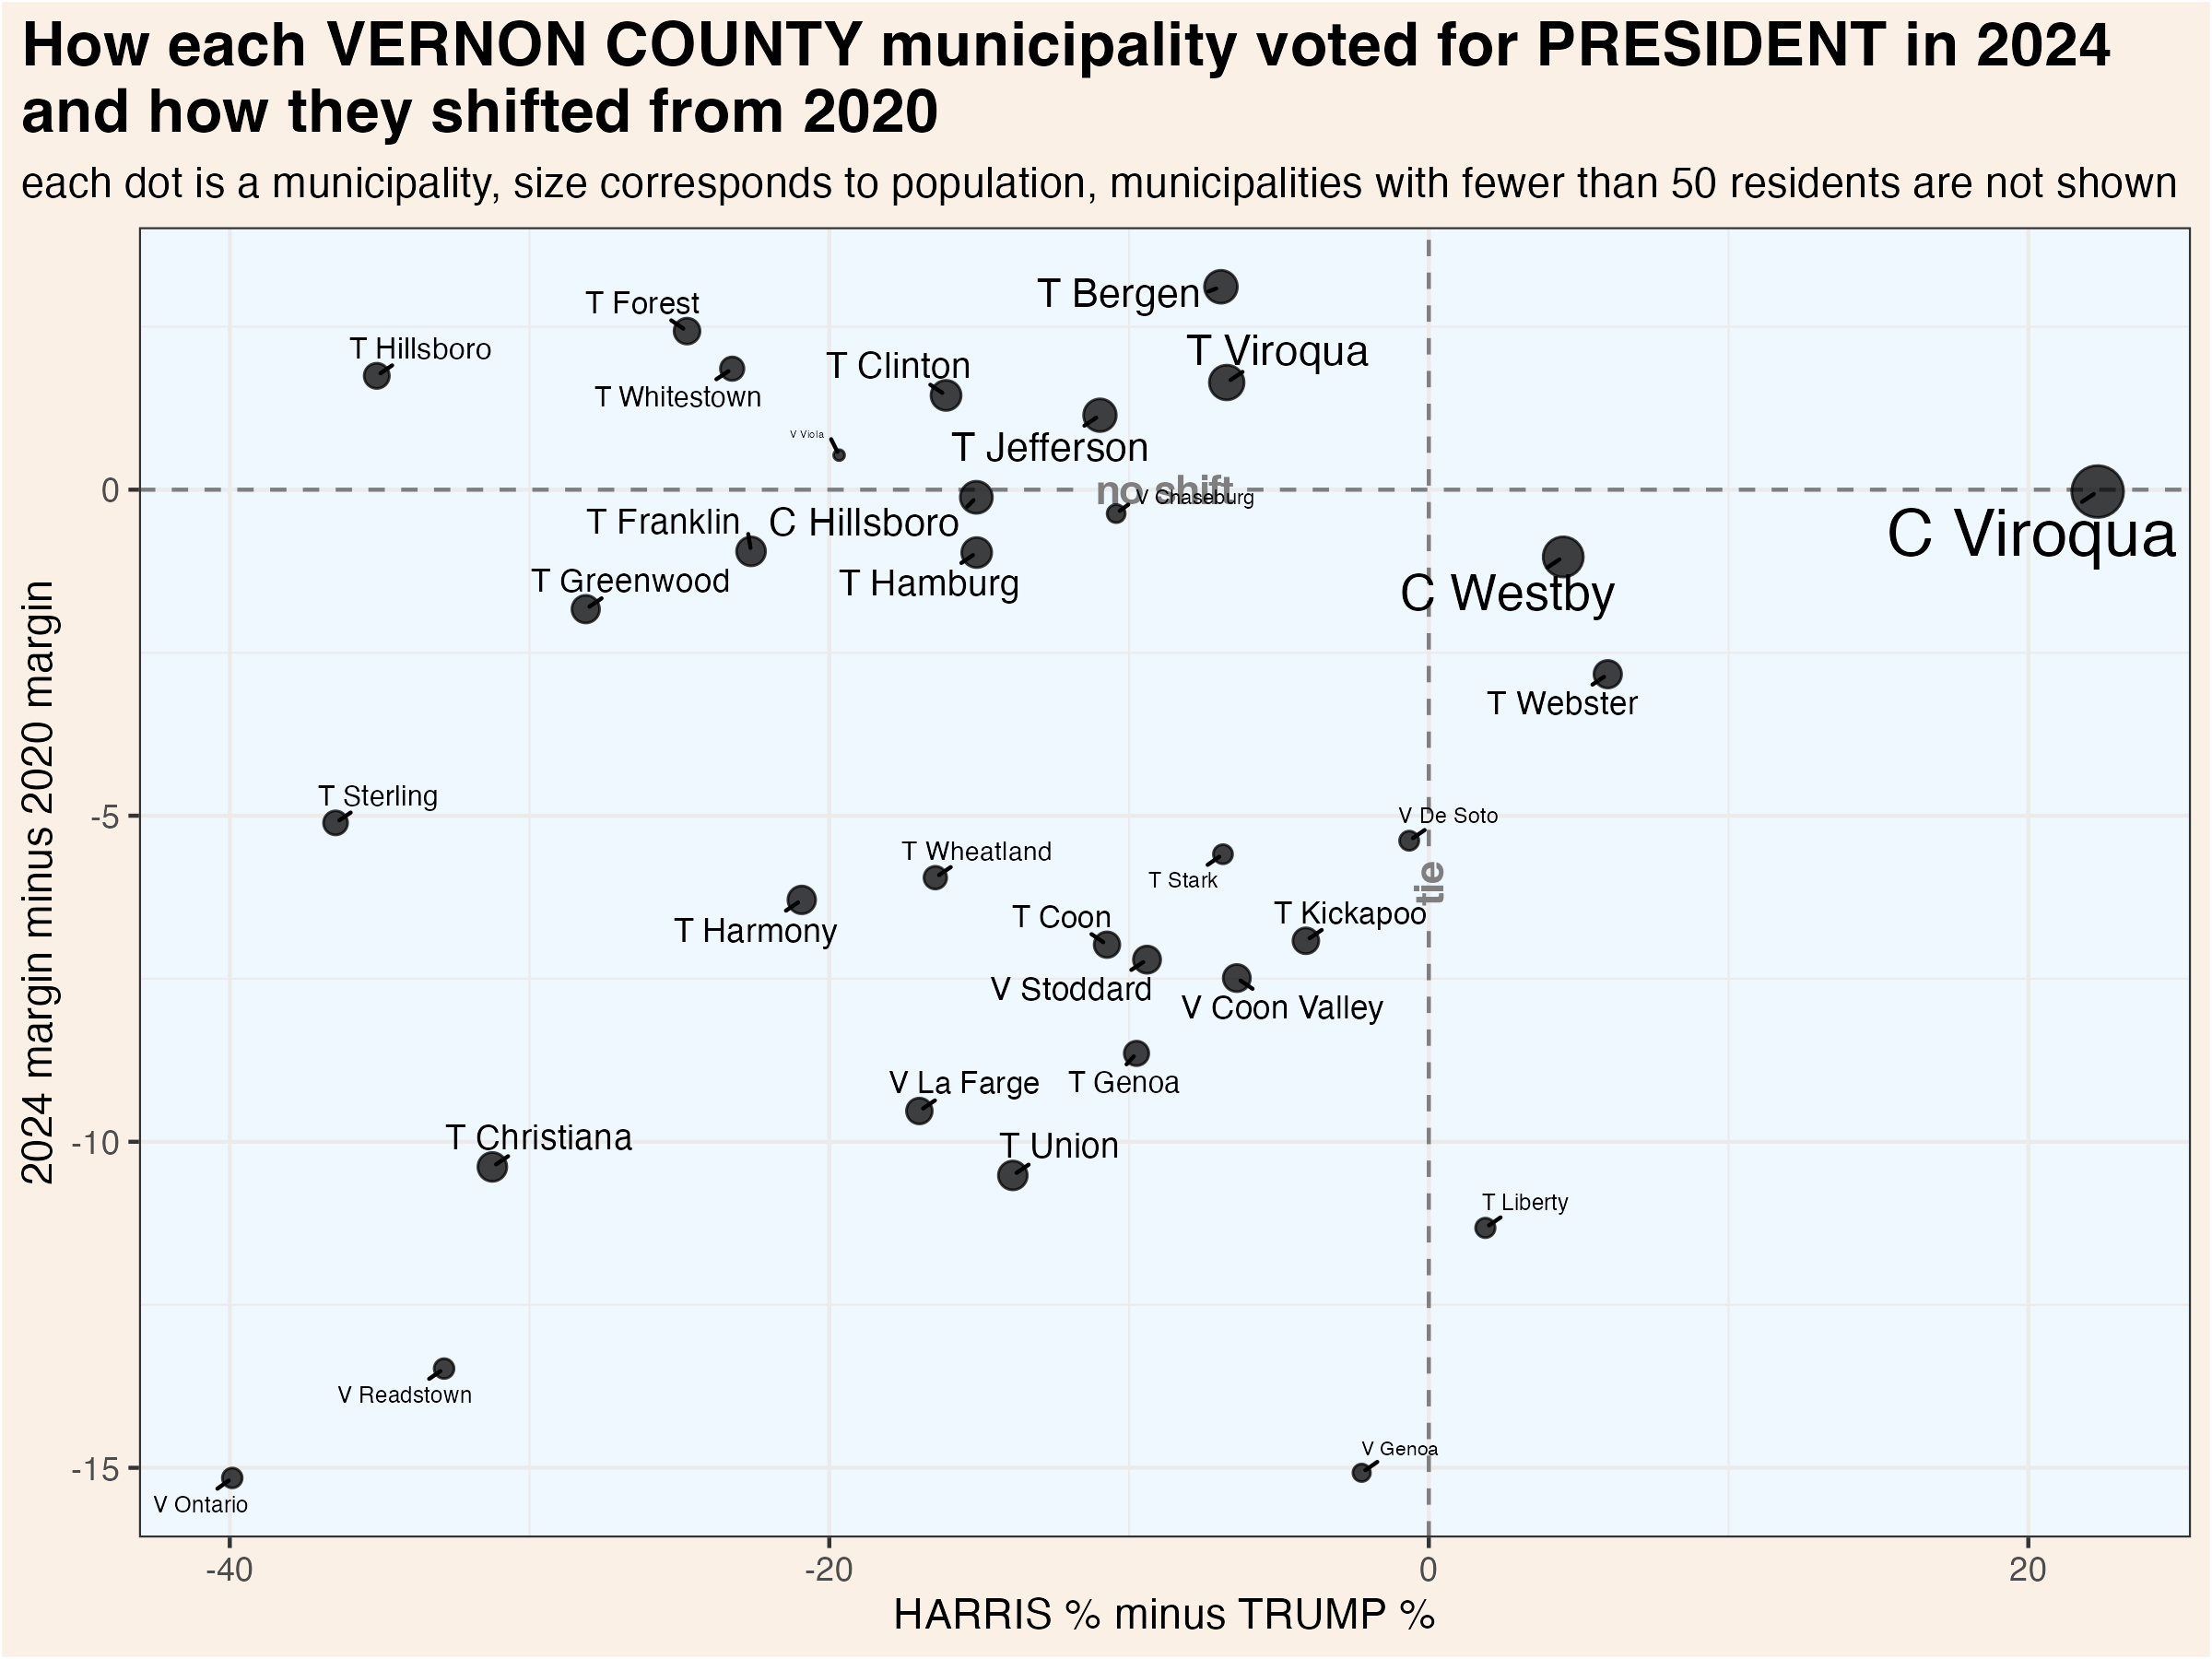
To more clearly illustrate recent changes in municipality voting trends, these scatterplots compare the most recent vote for president and senator with the shift from that office’s previous election.

These maps show show every election result since 2000 in each municipality.


Click each column name to sort its values.
65.4 Supreme Court Election Results
Wisconsin’s Supreme Court has 7 justices, each of whom are elected to 10 year terms in statewide elections held in April. State law prohibits more than one Supreme Court election from being held in a single year. If a seat becomes vacant, the governor appoints a replacement who serves until the next year in which no court election is already scheduled. If more than two candidates achieve ballot access, a nonpartisan, top-two primary is held in February.
Court elections are formally nonpartisan, but candidates are usually supported by either liberals or conservatives. In recent years, it has become common for the Democratic and Republican parties to endorse and actively campaign on behalf of favored judicial candidates. The liberal and conservative labels indicated in the following graphs and tables are based on widely recognized tendencies, not any formal affiliation.
65.4.1 County Election Results
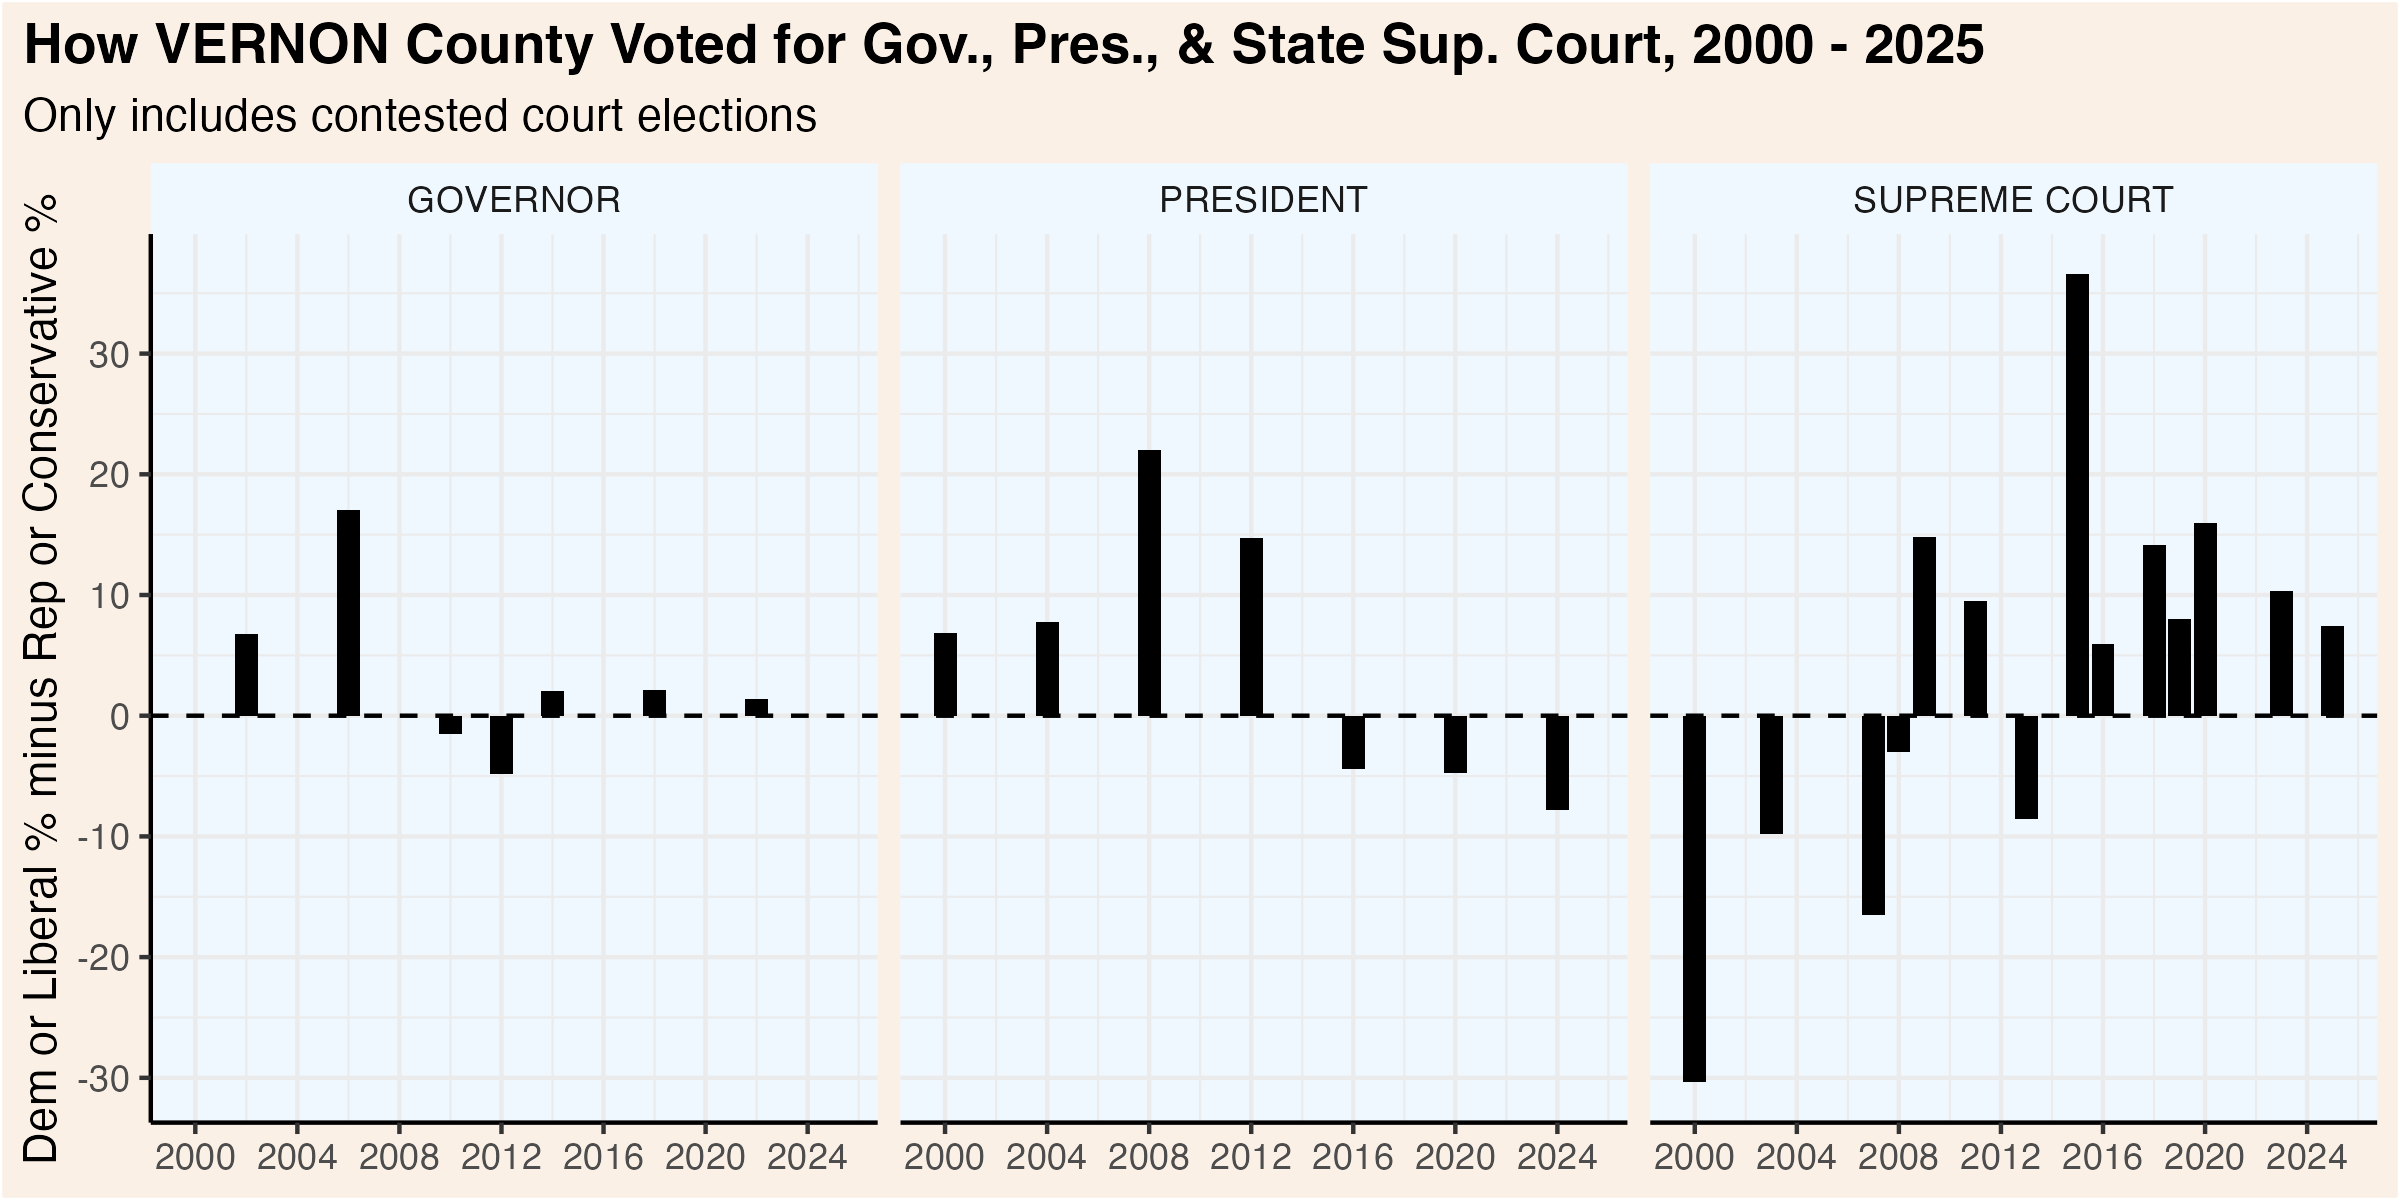
This graphic compares how presidential, gubernatorial, and court elections have trended over the past quarter century. Click the “Table” tab to see detailed results for the Supreme Court races.
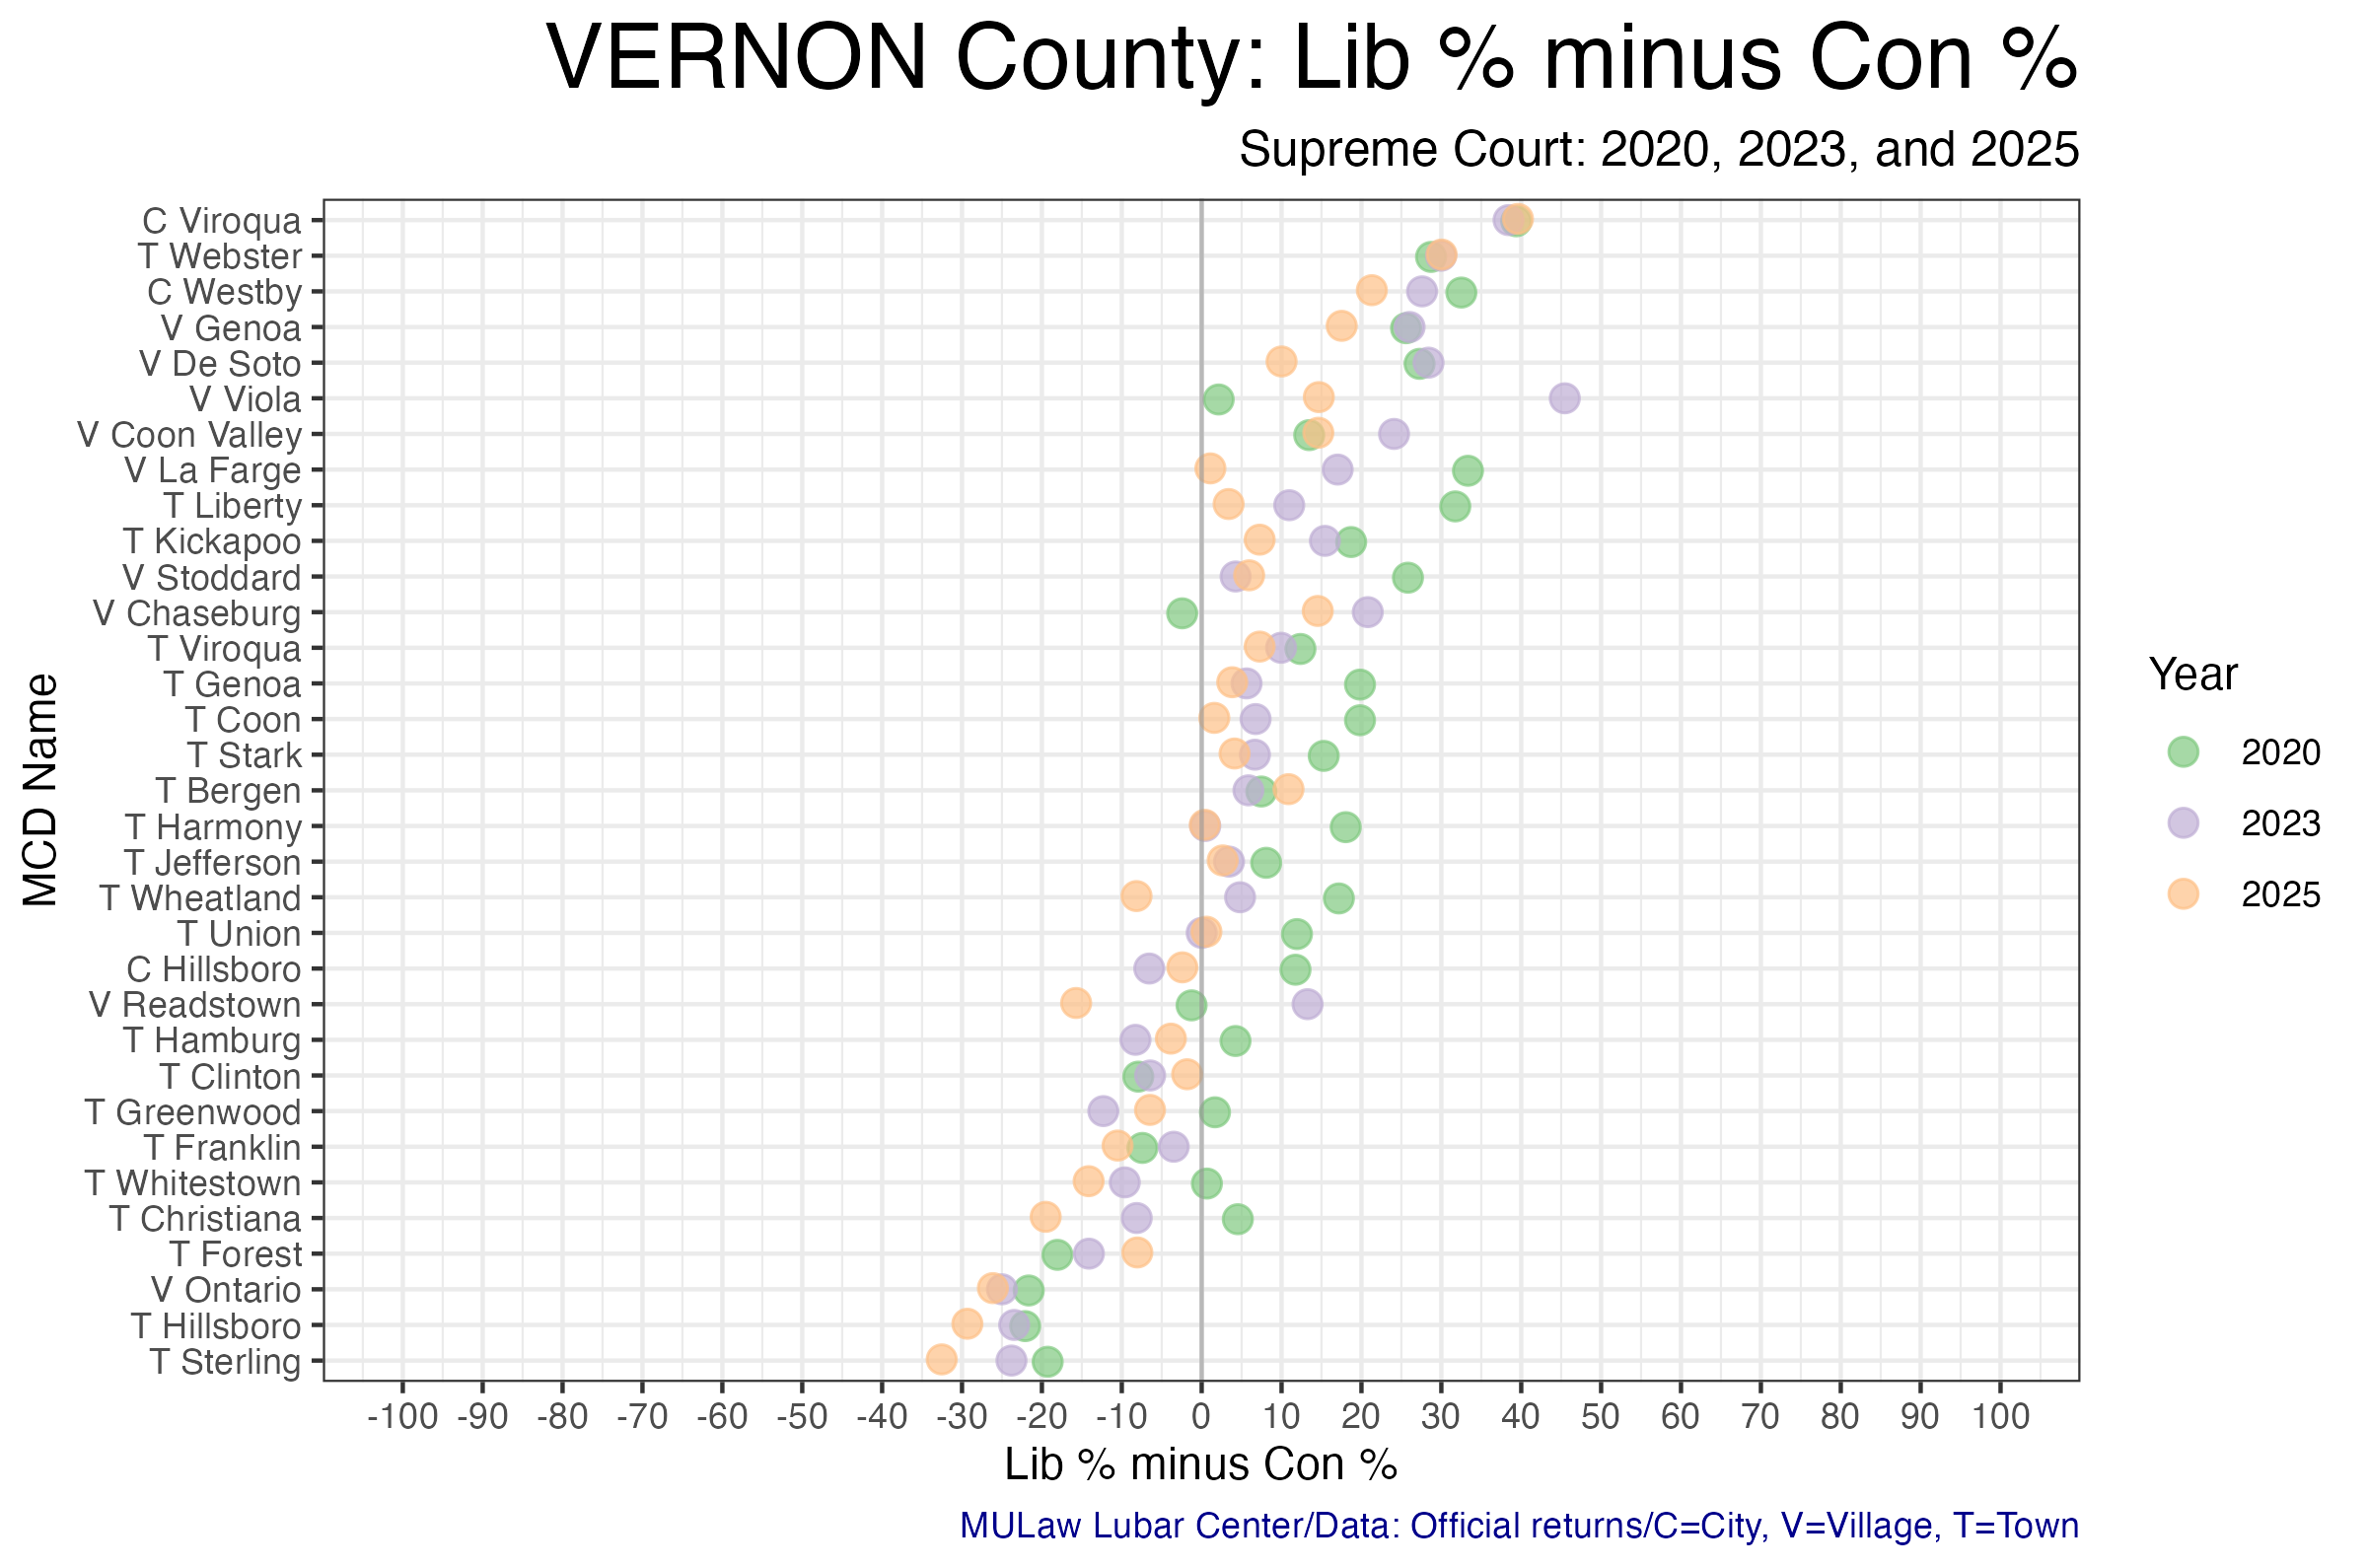
65.4.2 Municipality Election Results
The following table shows the results of each Supreme Court election by municipality. The graphic visualizes the shifts over the past three court elections.