33 Kewaunee
Kewaunee County (pop. 21,000) is located just south of Door County, along Lake Michigan. Its population is 93% white and just a fifth of residents over 24 have a college degree. The median income is higher than the state average and the poverty rate is lower. Politically, the county has become strongly Republican over the past decade.
33.1 Demographics

33.2 County Election Results

Click each column name to sort its values.
33.3 Municipality Election Results
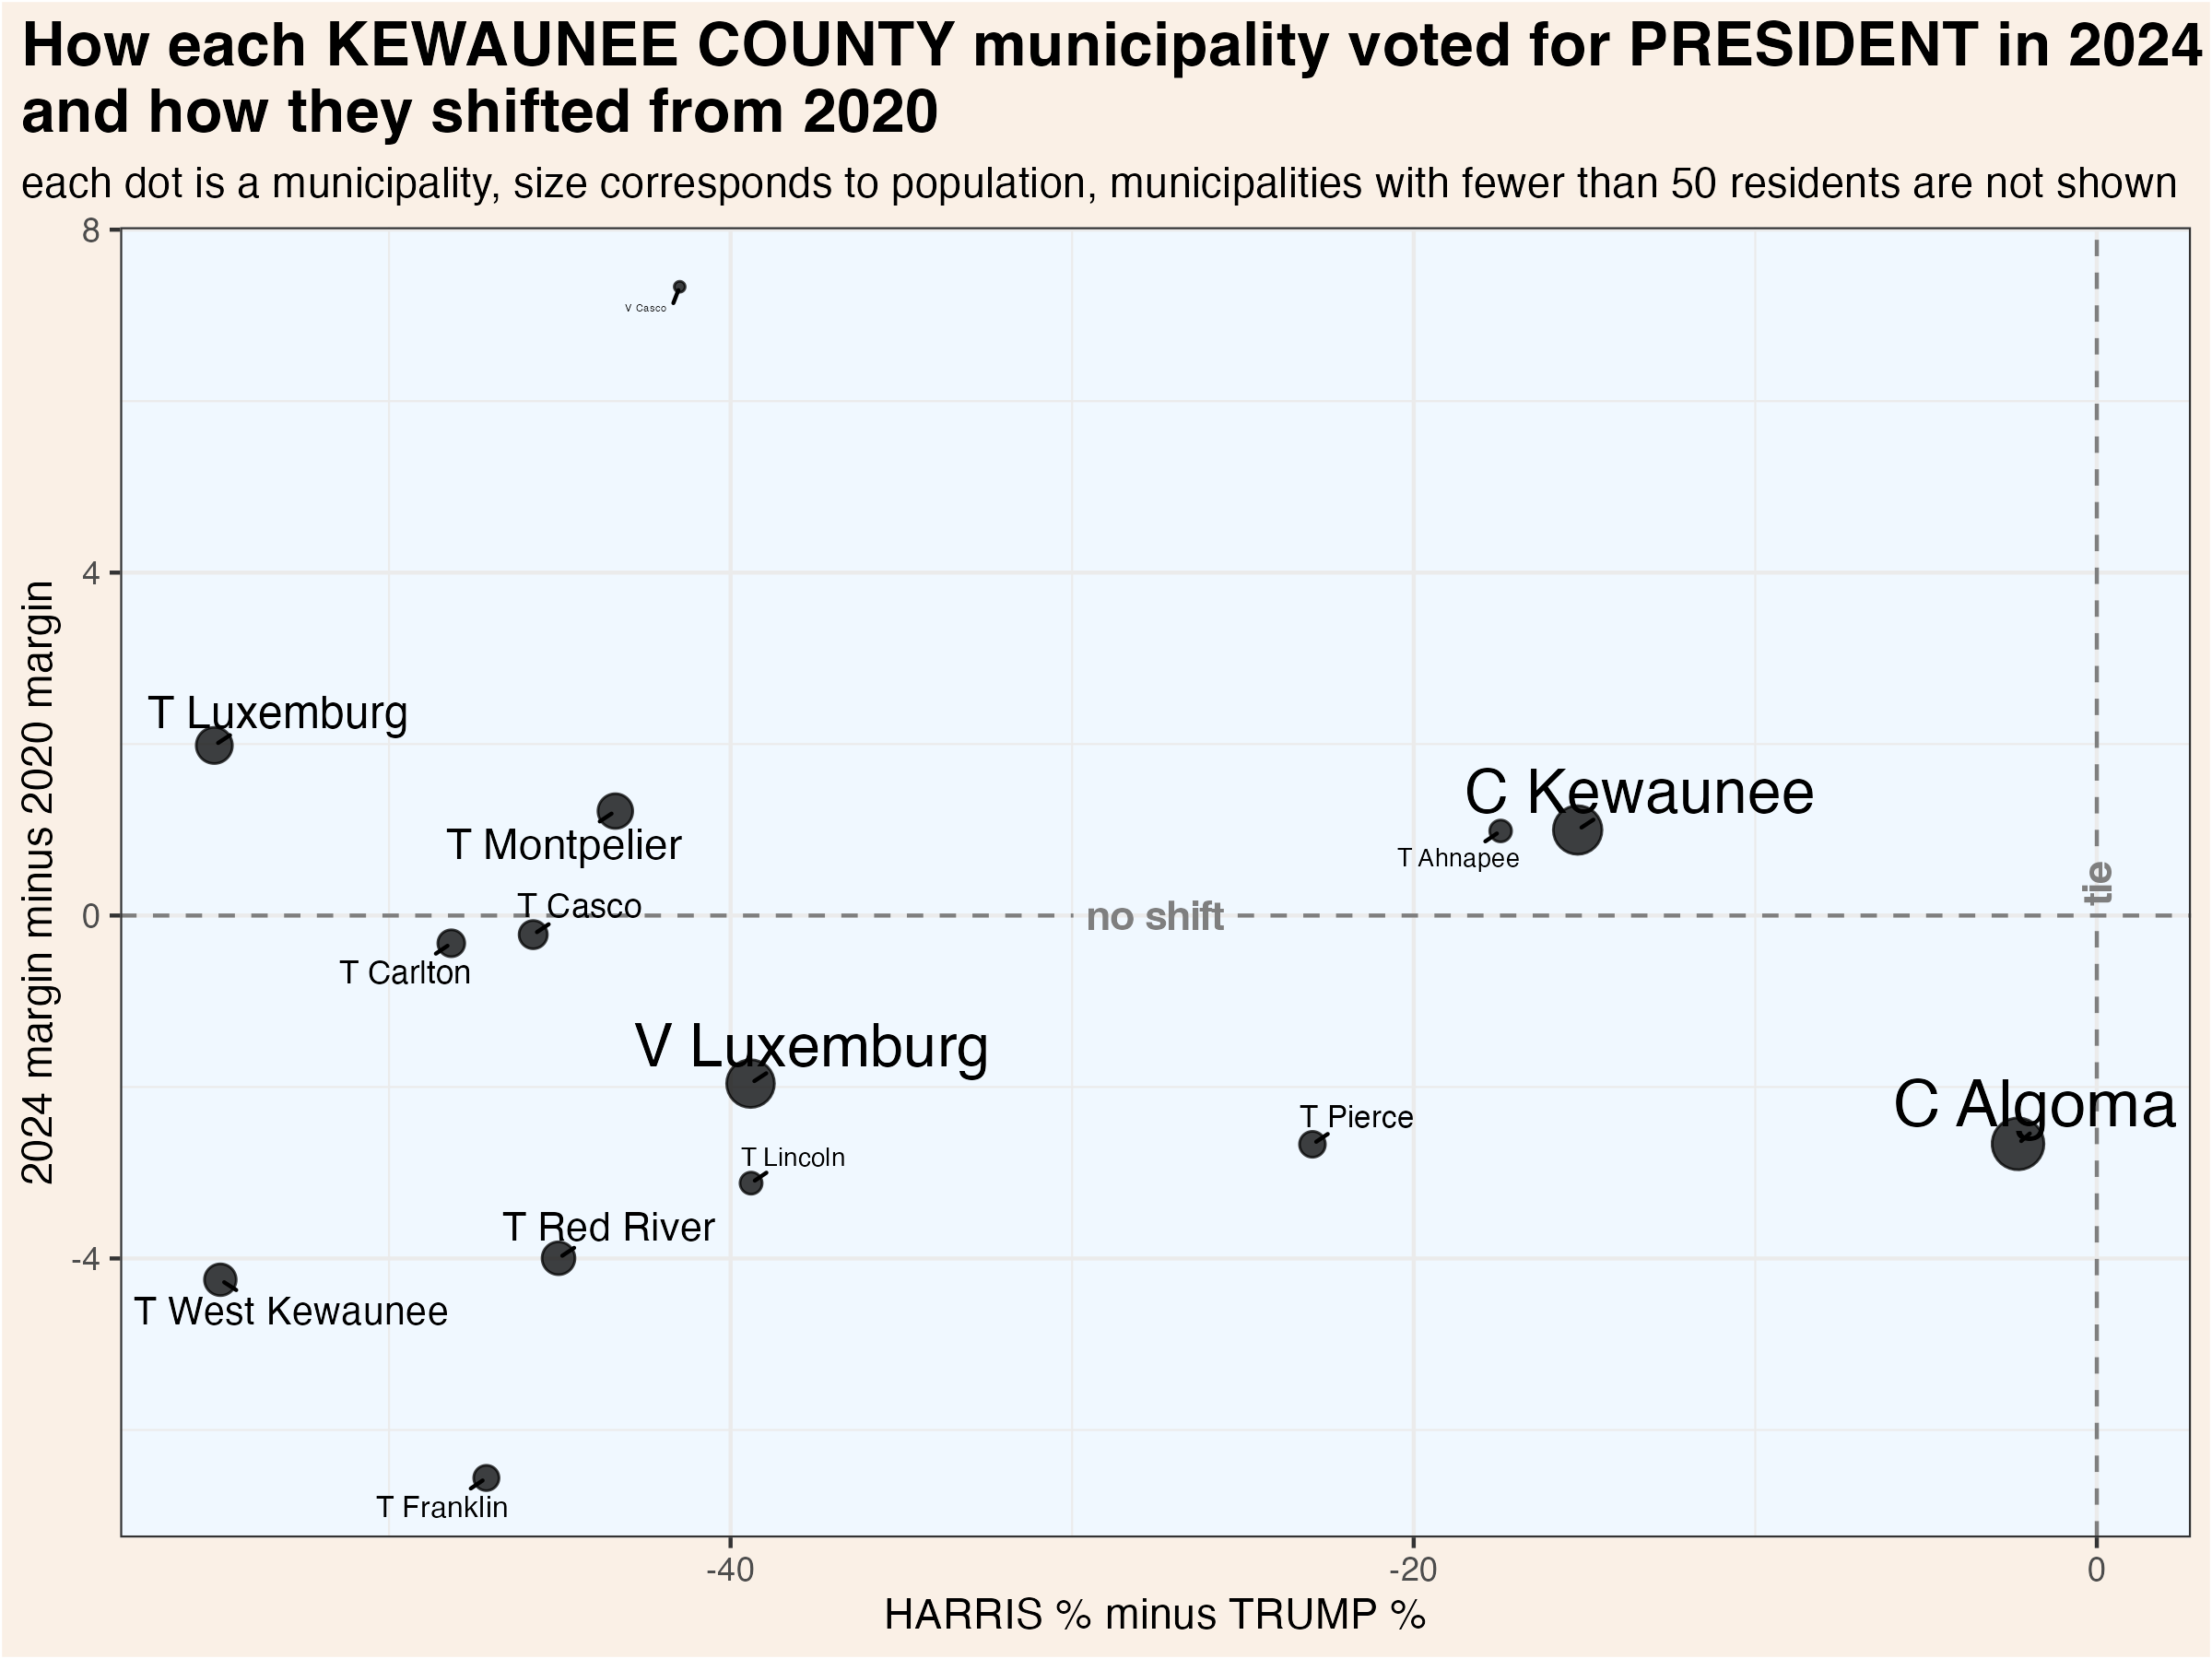
The largest municipality is Algoma City, followed by Kewaunee City, and Luxembourg Village. The City of Algoma is unusual among these municipalities in that it has actually moved in a Democratic direction over the last several election cycles. After voting for Scott Walker in 2014, it narrowly supported Tony Evers in 2018 before giving Evers a larger margin of victory in 2022.
This map shows the location of each municipality in the county, as it existed in 2022.

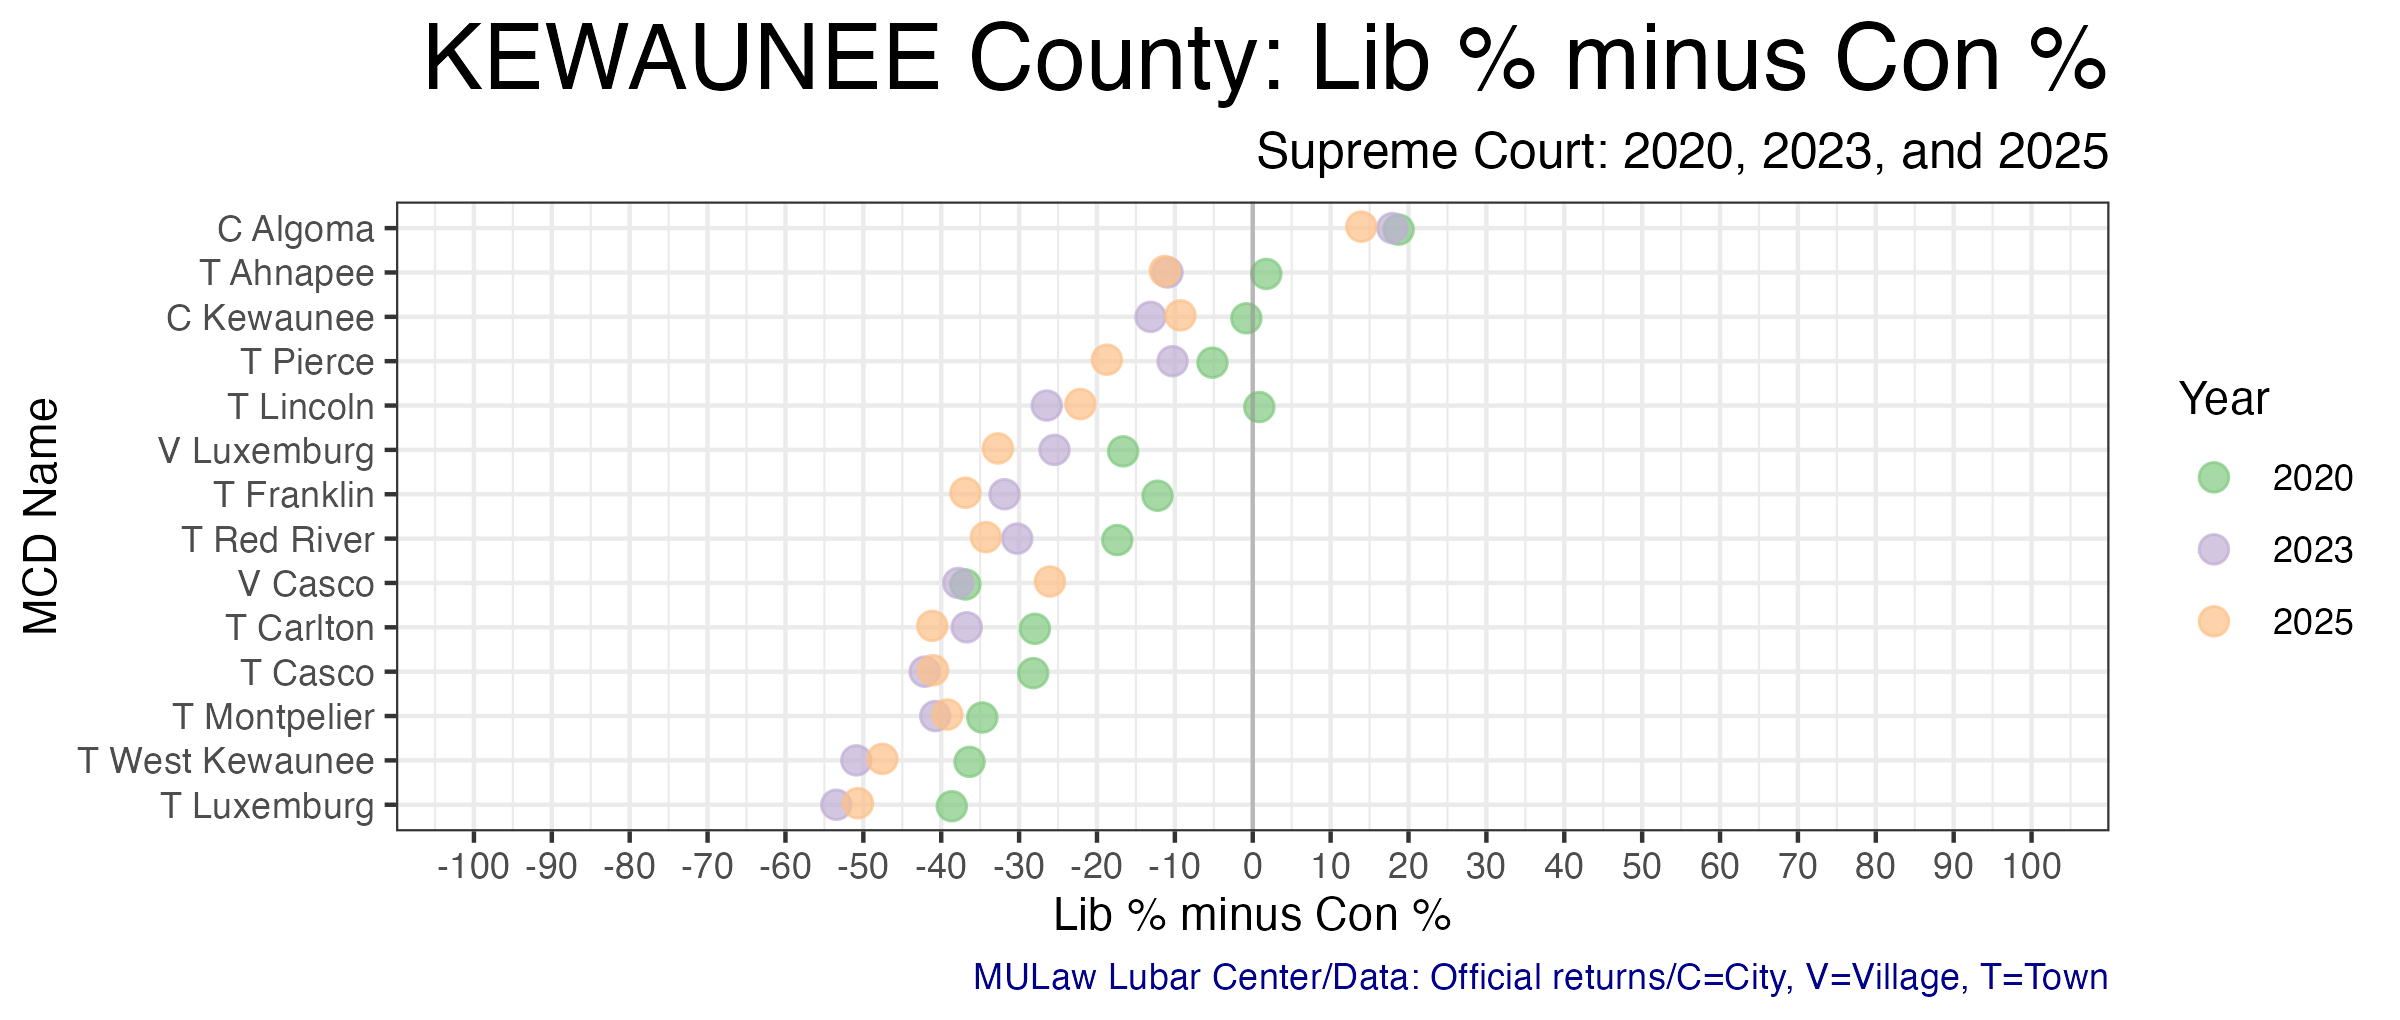
These dot plots show the most recent election results in each municipality.


To more clearly illustrate recent changes in municipality voting trends, these scatterplots compare the most recent vote for president and senator with the shift from that office’s previous election.

These maps show show every election result since 2000 in each municipality.


Click each column name to sort its values.
33.4 Supreme Court Election Results
Wisconsin’s Supreme Court has 7 justices, each of whom are elected to 10 year terms in statewide elections held in April. State law prohibits more than one Supreme Court election from being held in a single year. If a seat becomes vacant, the governor appoints a replacement who serves until the next year in which no court election is already scheduled. If more than two candidates achieve ballot access, a nonpartisan, top-two primary is held in February.
Court elections are formally nonpartisan, but candidates are usually supported by either liberals or conservatives. In recent years, it has become common for the Democratic and Republican parties to endorse and actively campaign on behalf of favored judicial candidates. The liberal and conservative labels indicated in the following graphs and tables are based on widely recognized tendencies, not any formal affiliation.
33.4.1 County Election Results
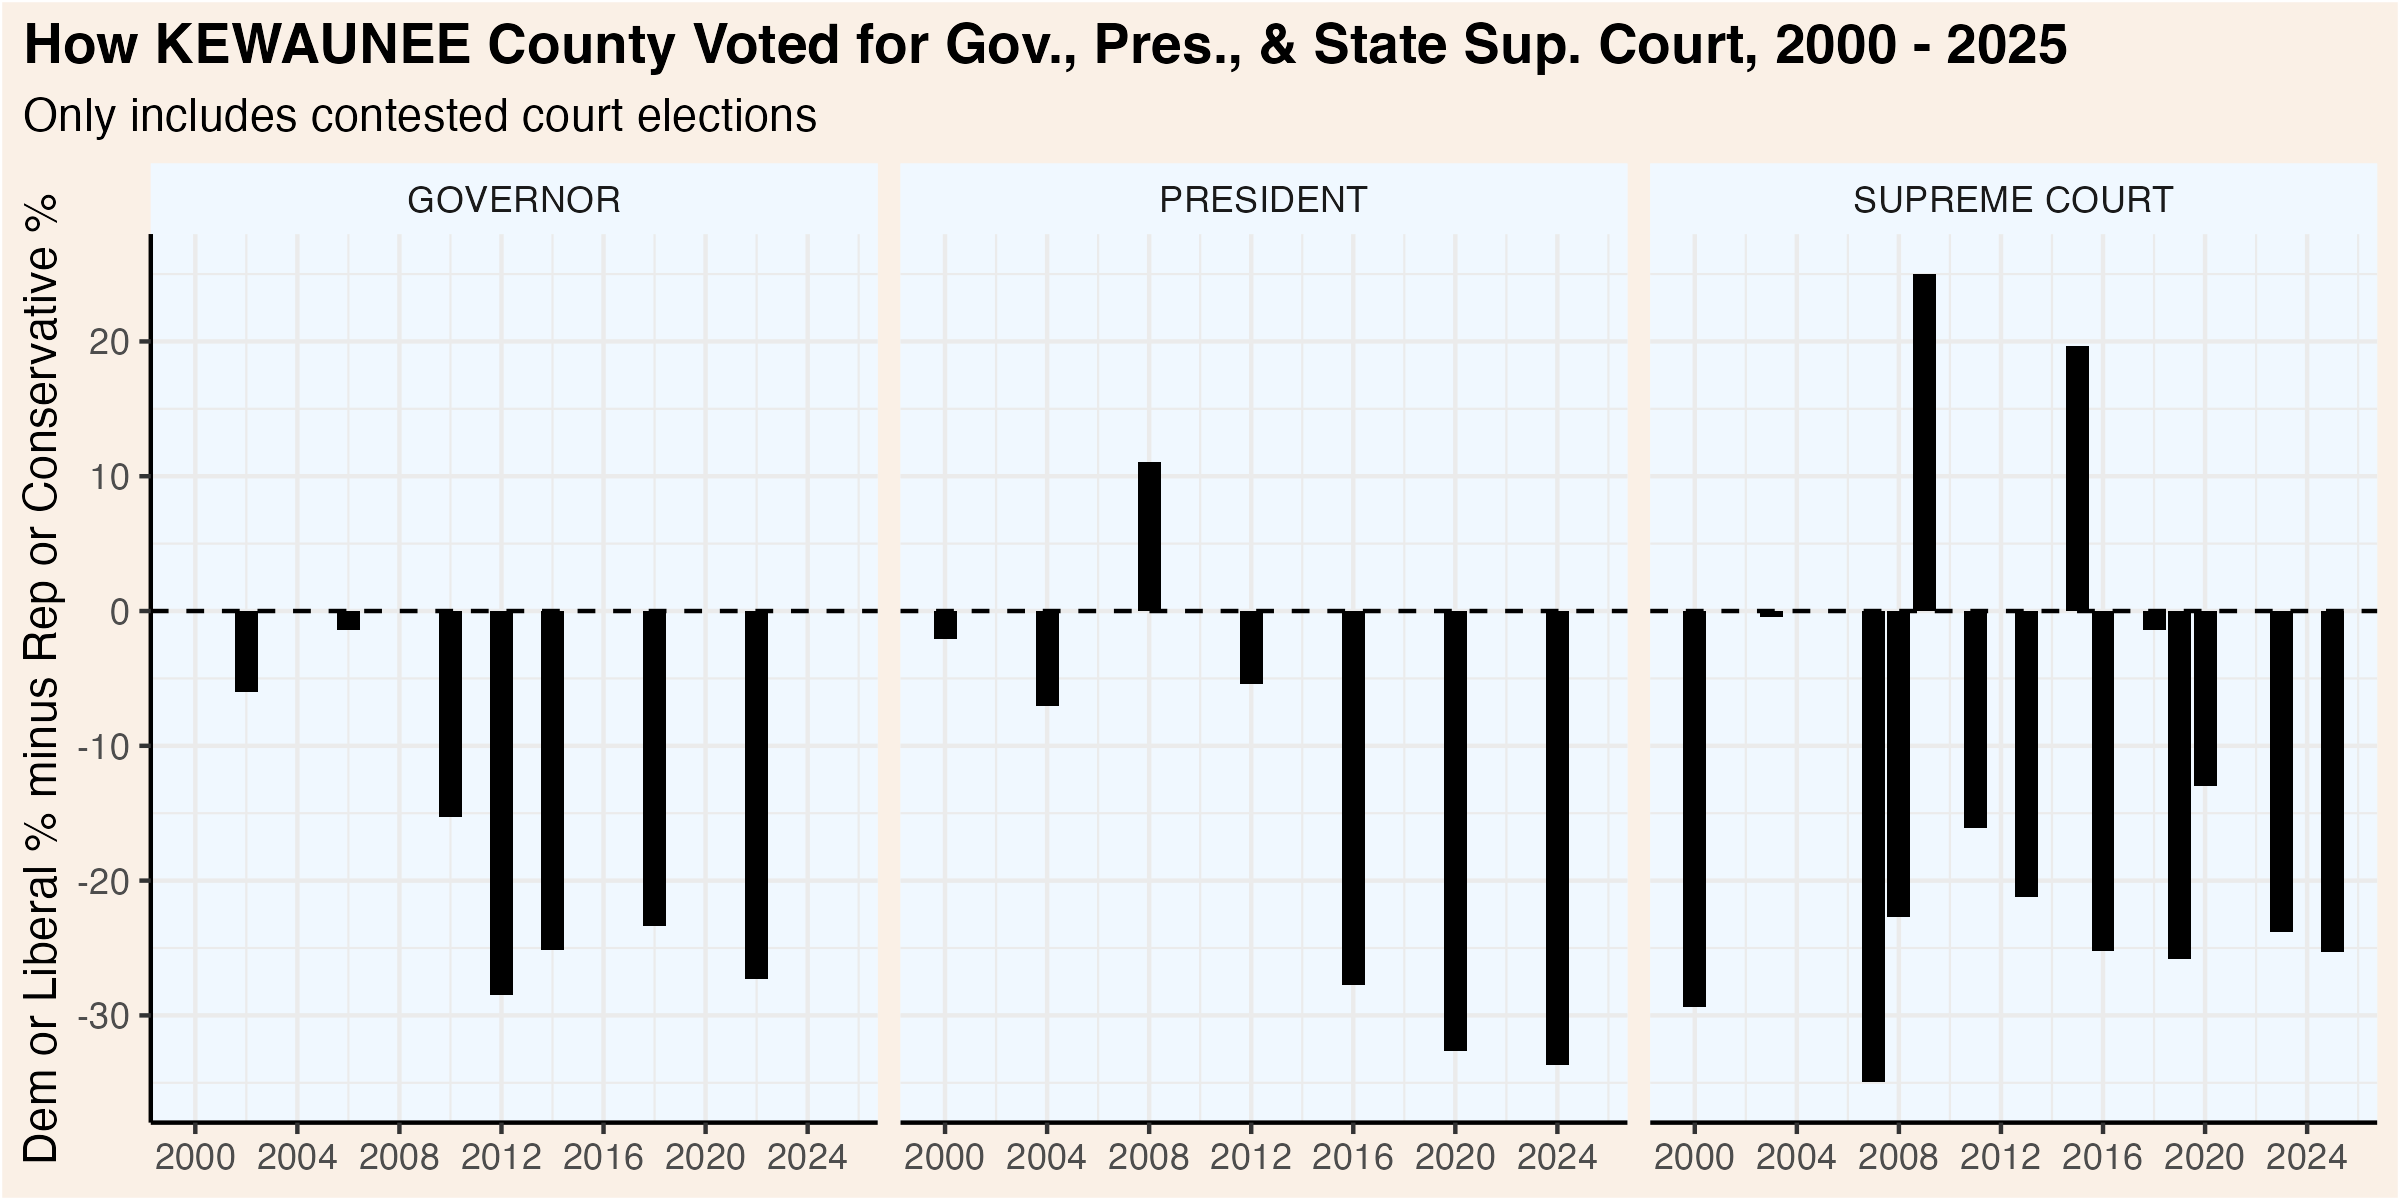
This graphic compares how presidential, gubernatorial, and court elections have trended over the past quarter century. Click the “Table” tab to see detailed results for the Supreme Court races.
33.4.2 Municipality Election Results
The following table shows the results of each Supreme Court election by municipality. The graphic visualizes the shifts over the past three court elections.