56 Rock
Rock County (pop. 164,000) is located in south central Wisconsin just north of Rockford, Illinois. The state quite closely matches the state average in terms of racial composition, median age, income, poverty rate, and population density. Educational attainment levels are somewhat lower. Politically, the county leans Democratic.
56.1 Demographics

56.2 County Election Results

Click each column name to sort its values.
56.3 Municipality Election Results
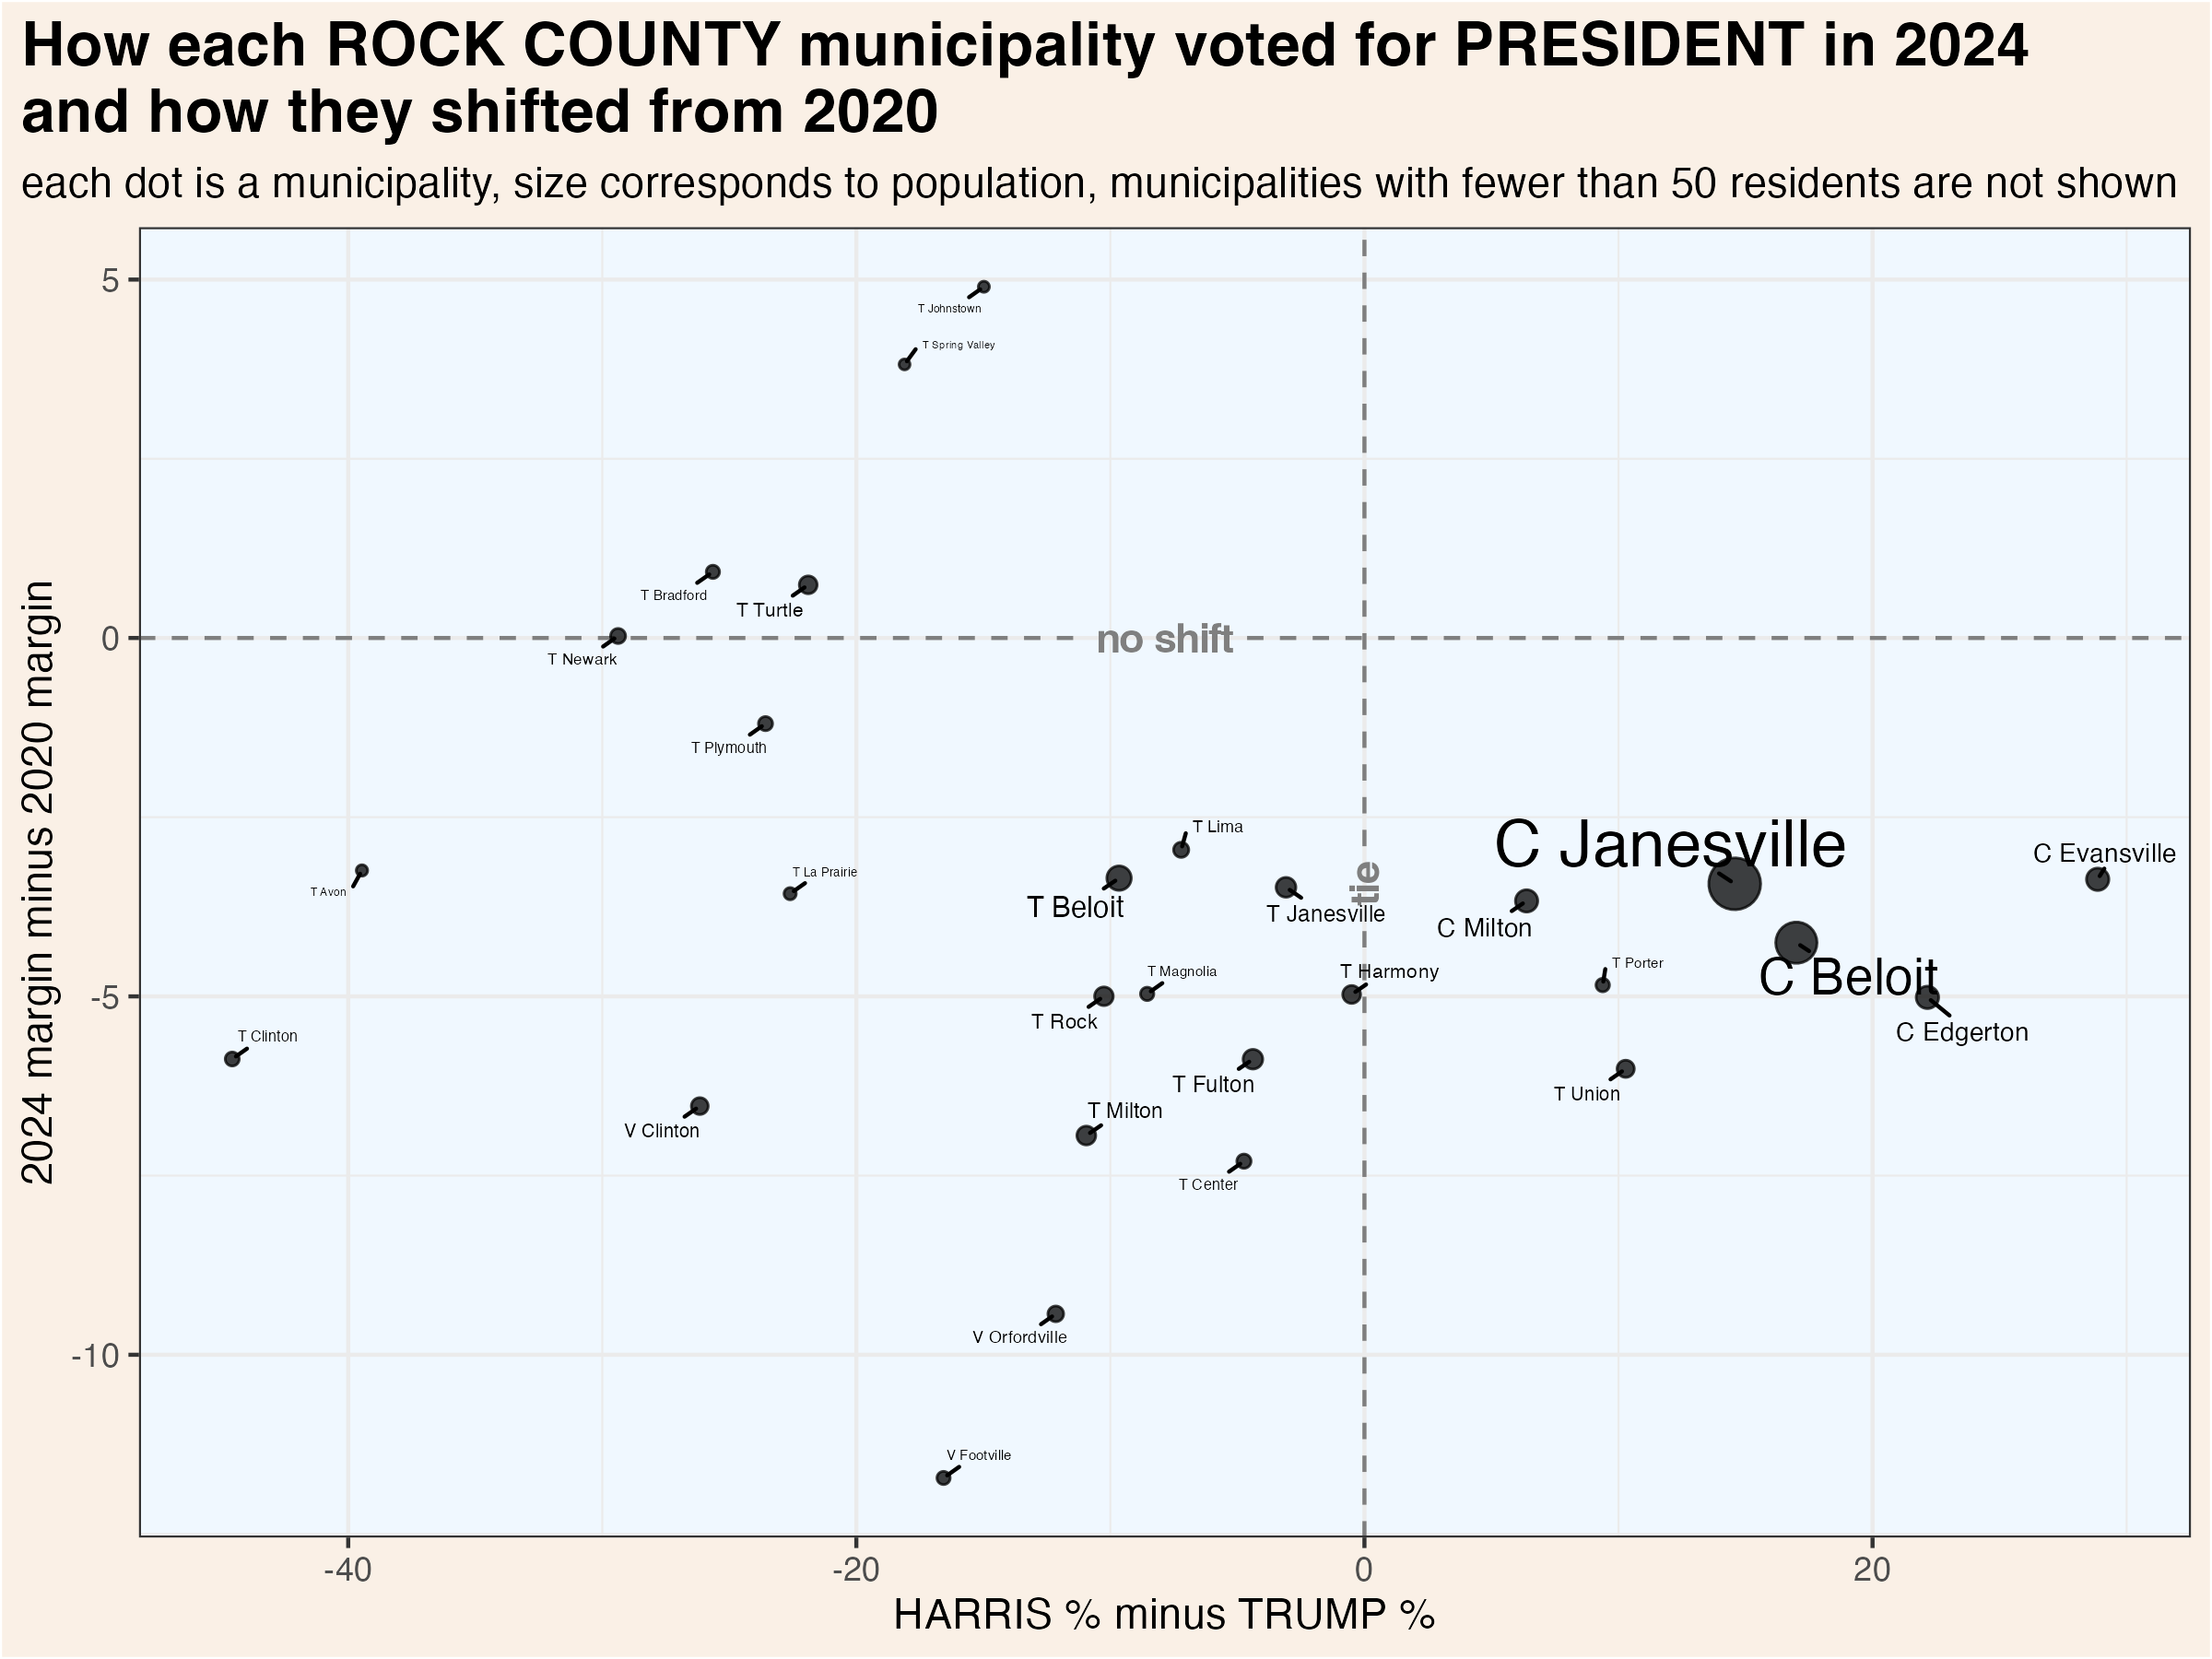
Two cities, Janesville and Beloit, account for roughly 60% of the county’s population, while several other communities also include more than 5,000 residents. The Democratic lean to Rock County comes from these more populous municipalities, including the cities of Evansville, Edgerton, Beloit, and Janesville. Many of the less populous rural towns, including Clinton, Bradford, Newark, and Avon, are strongly Republican.
This map shows the location of each municipality in the county, as it existed in 2022.

These dot plots show the most recent election results in each municipality.


To more clearly illustrate recent changes in municipality voting trends, these scatterplots compare the most recent vote for president and senator with the shift from that office’s previous election.

These maps show show every election result since 2000 in each municipality.


Click each column name to sort its values.
56.4 Supreme Court Election Results
Wisconsin’s Supreme Court has 7 justices, each of whom are elected to 10 year terms in statewide elections held in April. State law prohibits more than one Supreme Court election from being held in a single year. If a seat becomes vacant, the governor appoints a replacement who serves until the next year in which no court election is already scheduled. If more than two candidates achieve ballot access, a nonpartisan, top-two primary is held in February.
Court elections are formally nonpartisan, but candidates are usually supported by either liberals or conservatives. In recent years, it has become common for the Democratic and Republican parties to endorse and actively campaign on behalf of favored judicial candidates. The liberal and conservative labels indicated in the following graphs and tables are based on widely recognized tendencies, not any formal affiliation.
56.4.1 County Election Results
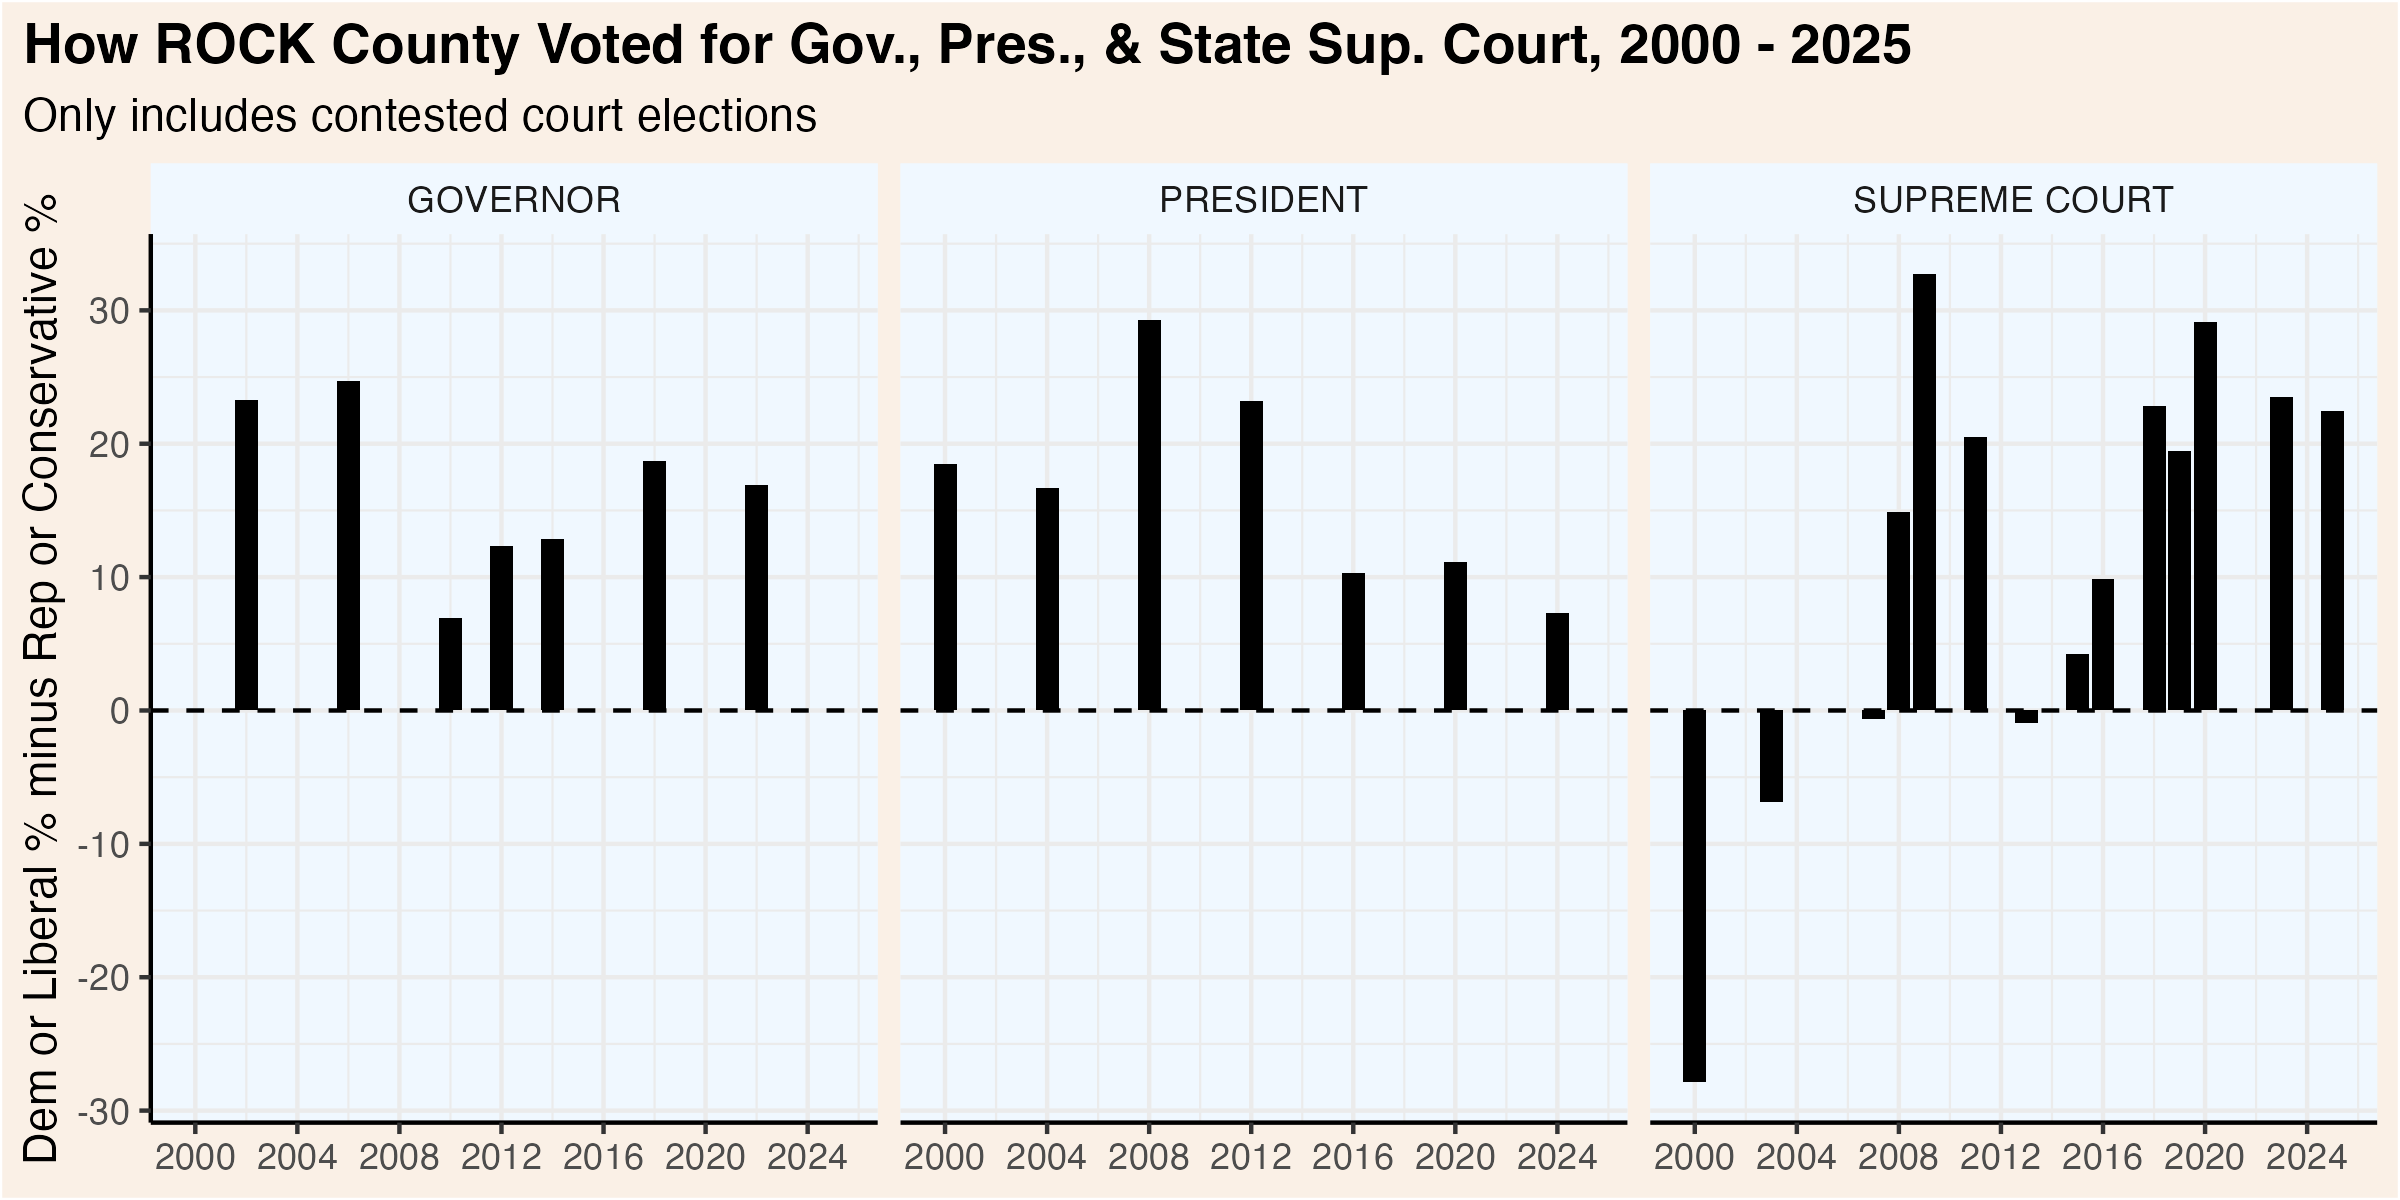
This graphic compares how presidential, gubernatorial, and court elections have trended over the past quarter century. Click the “Table” tab to see detailed results for the Supreme Court races.
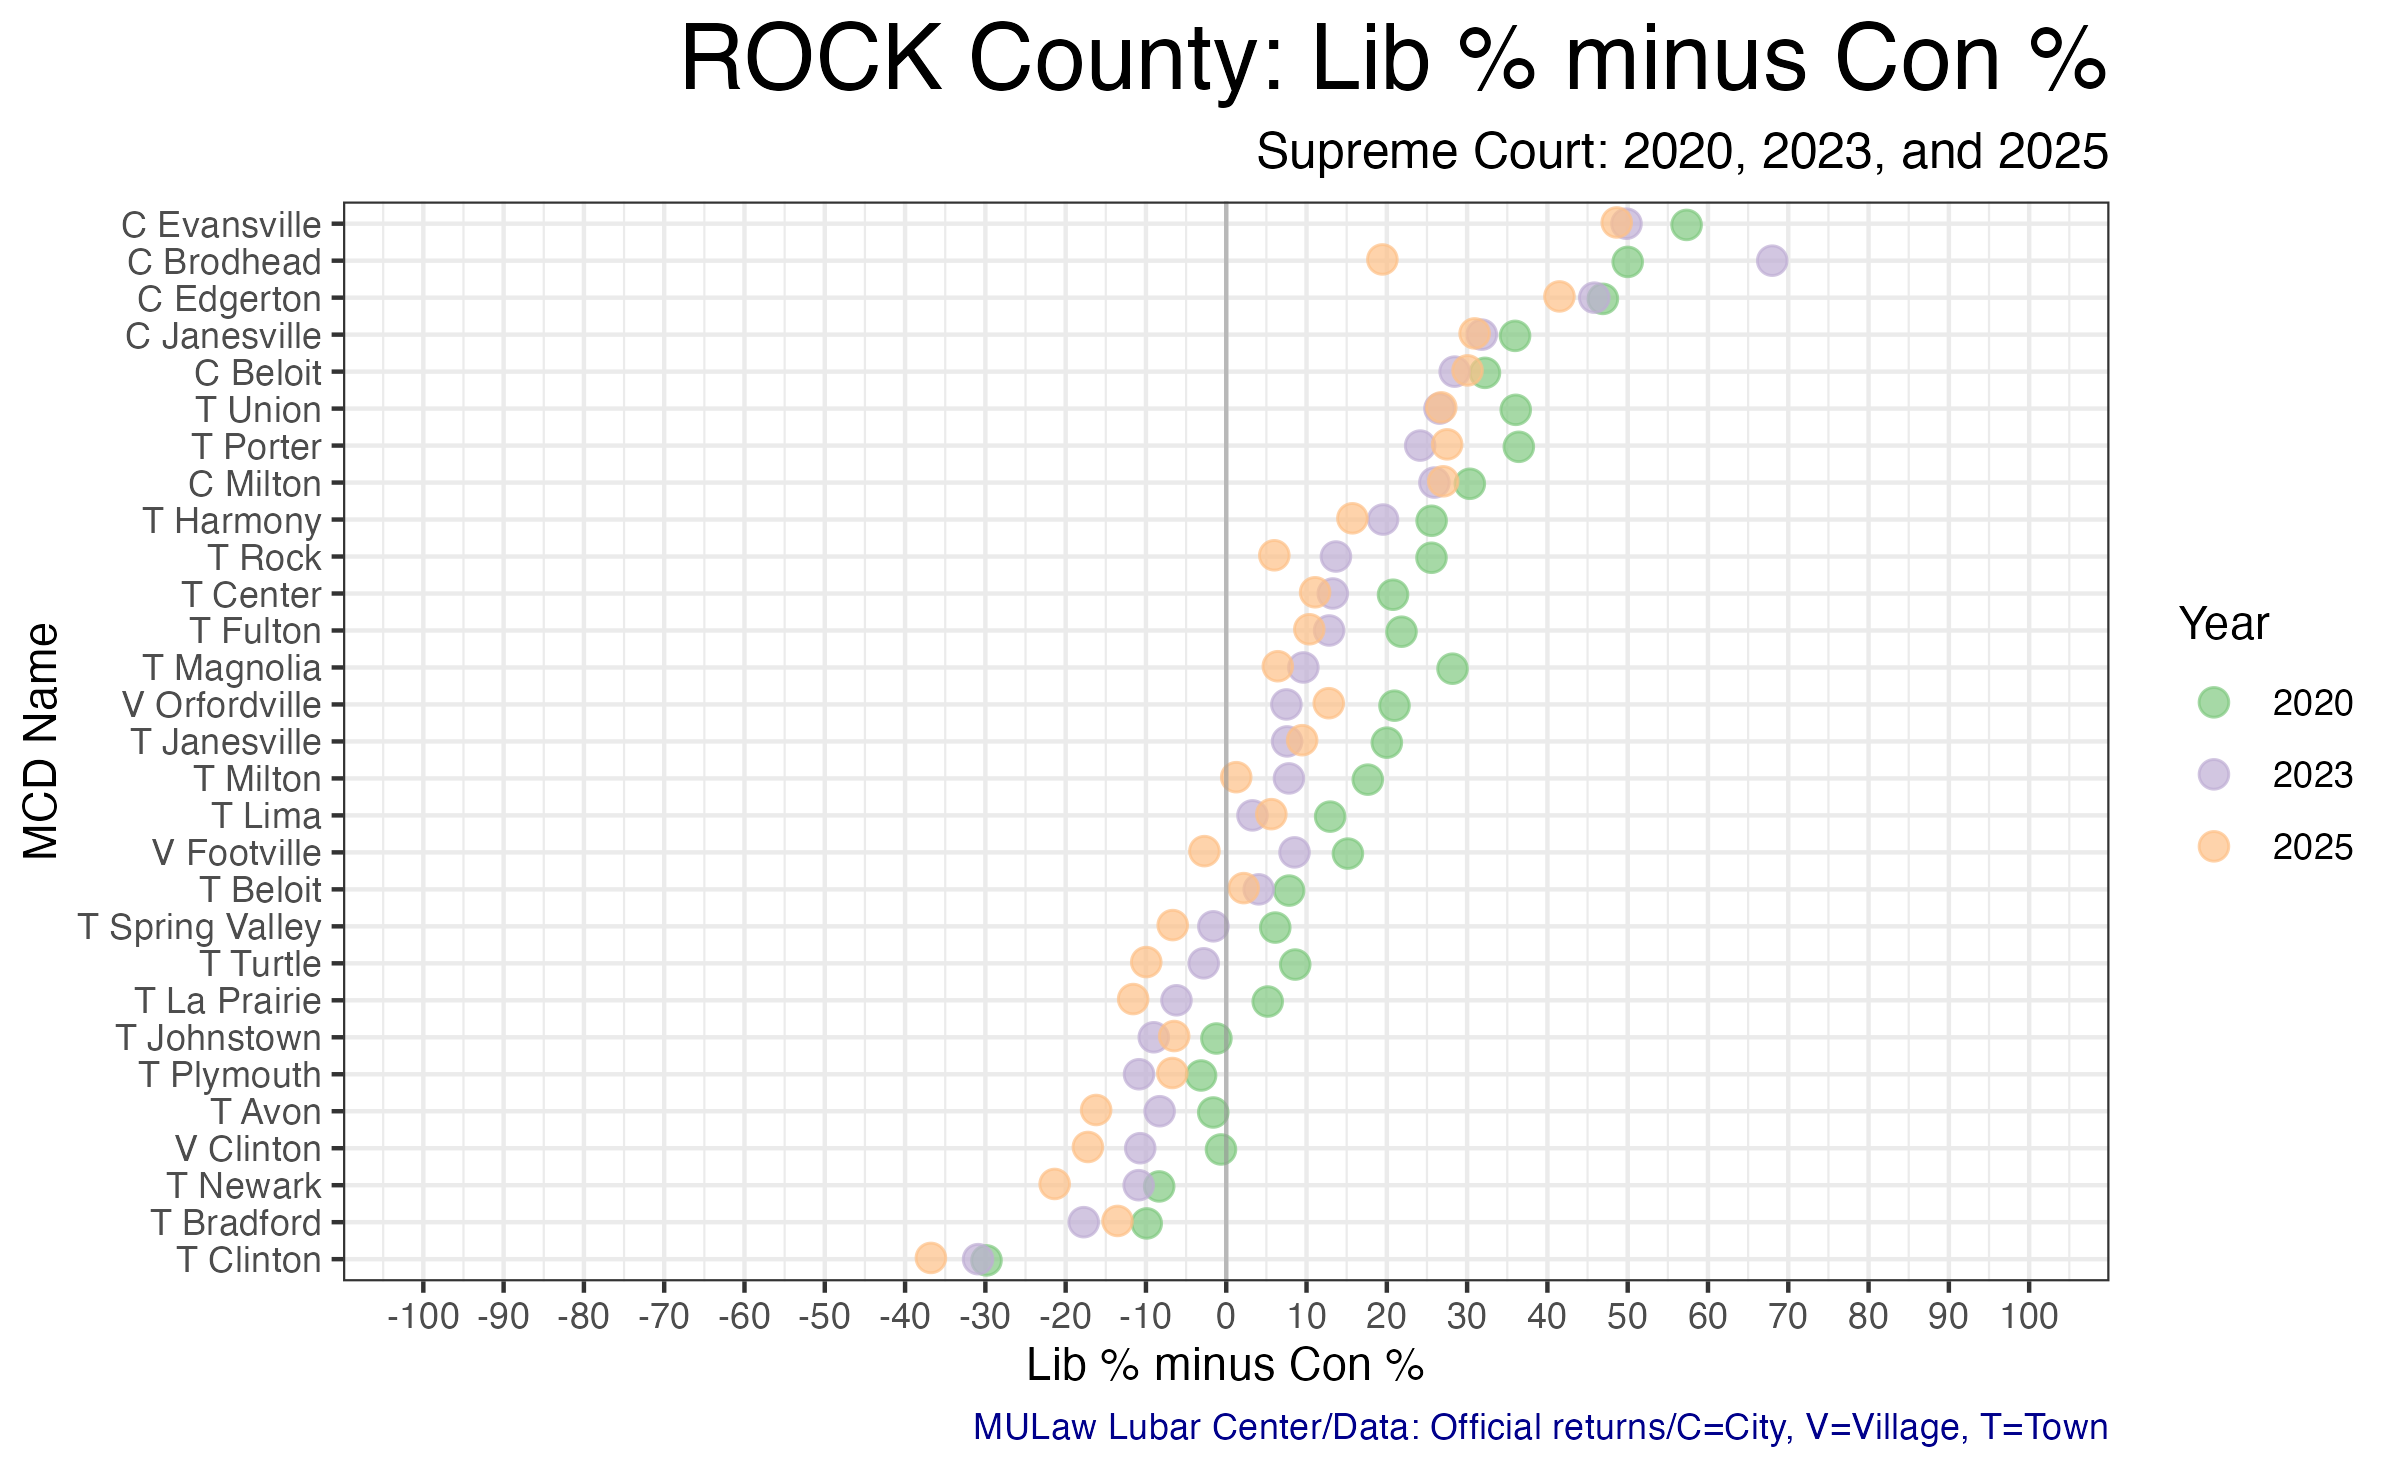
56.4.2 Municipality Election Results
The following table shows the results of each Supreme Court election by municipality. The graphic visualizes the shifts over the past three court elections.