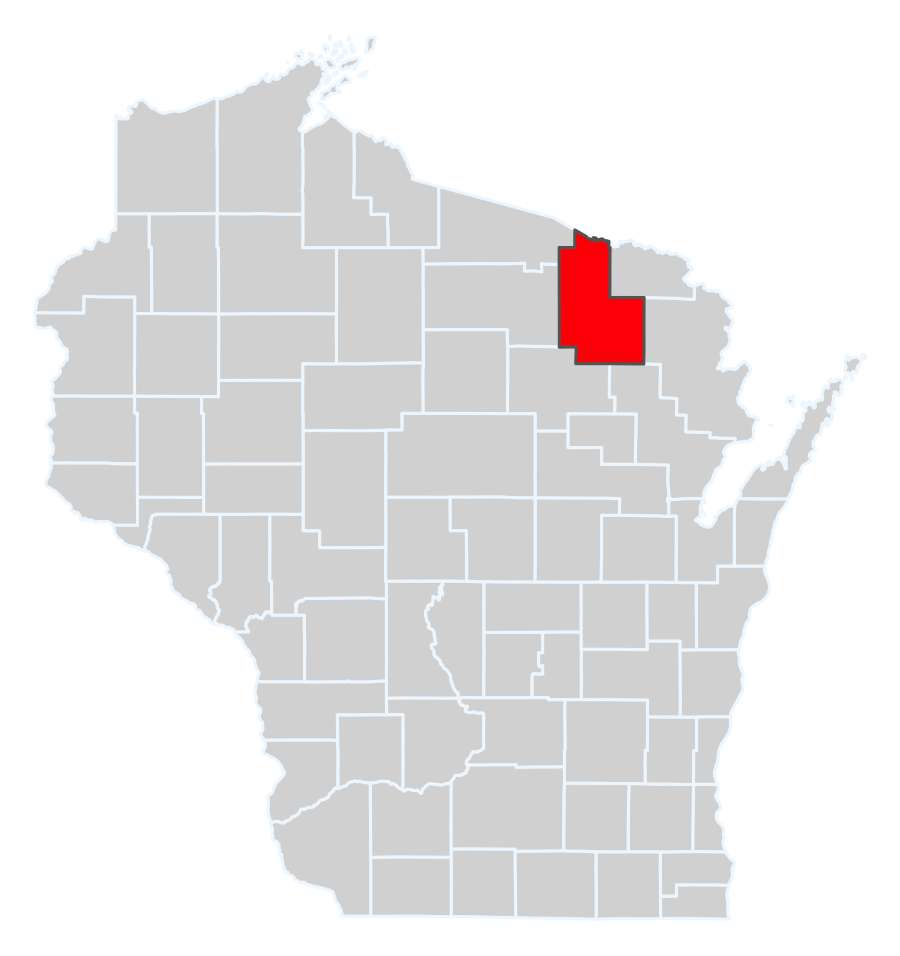
23 Forest
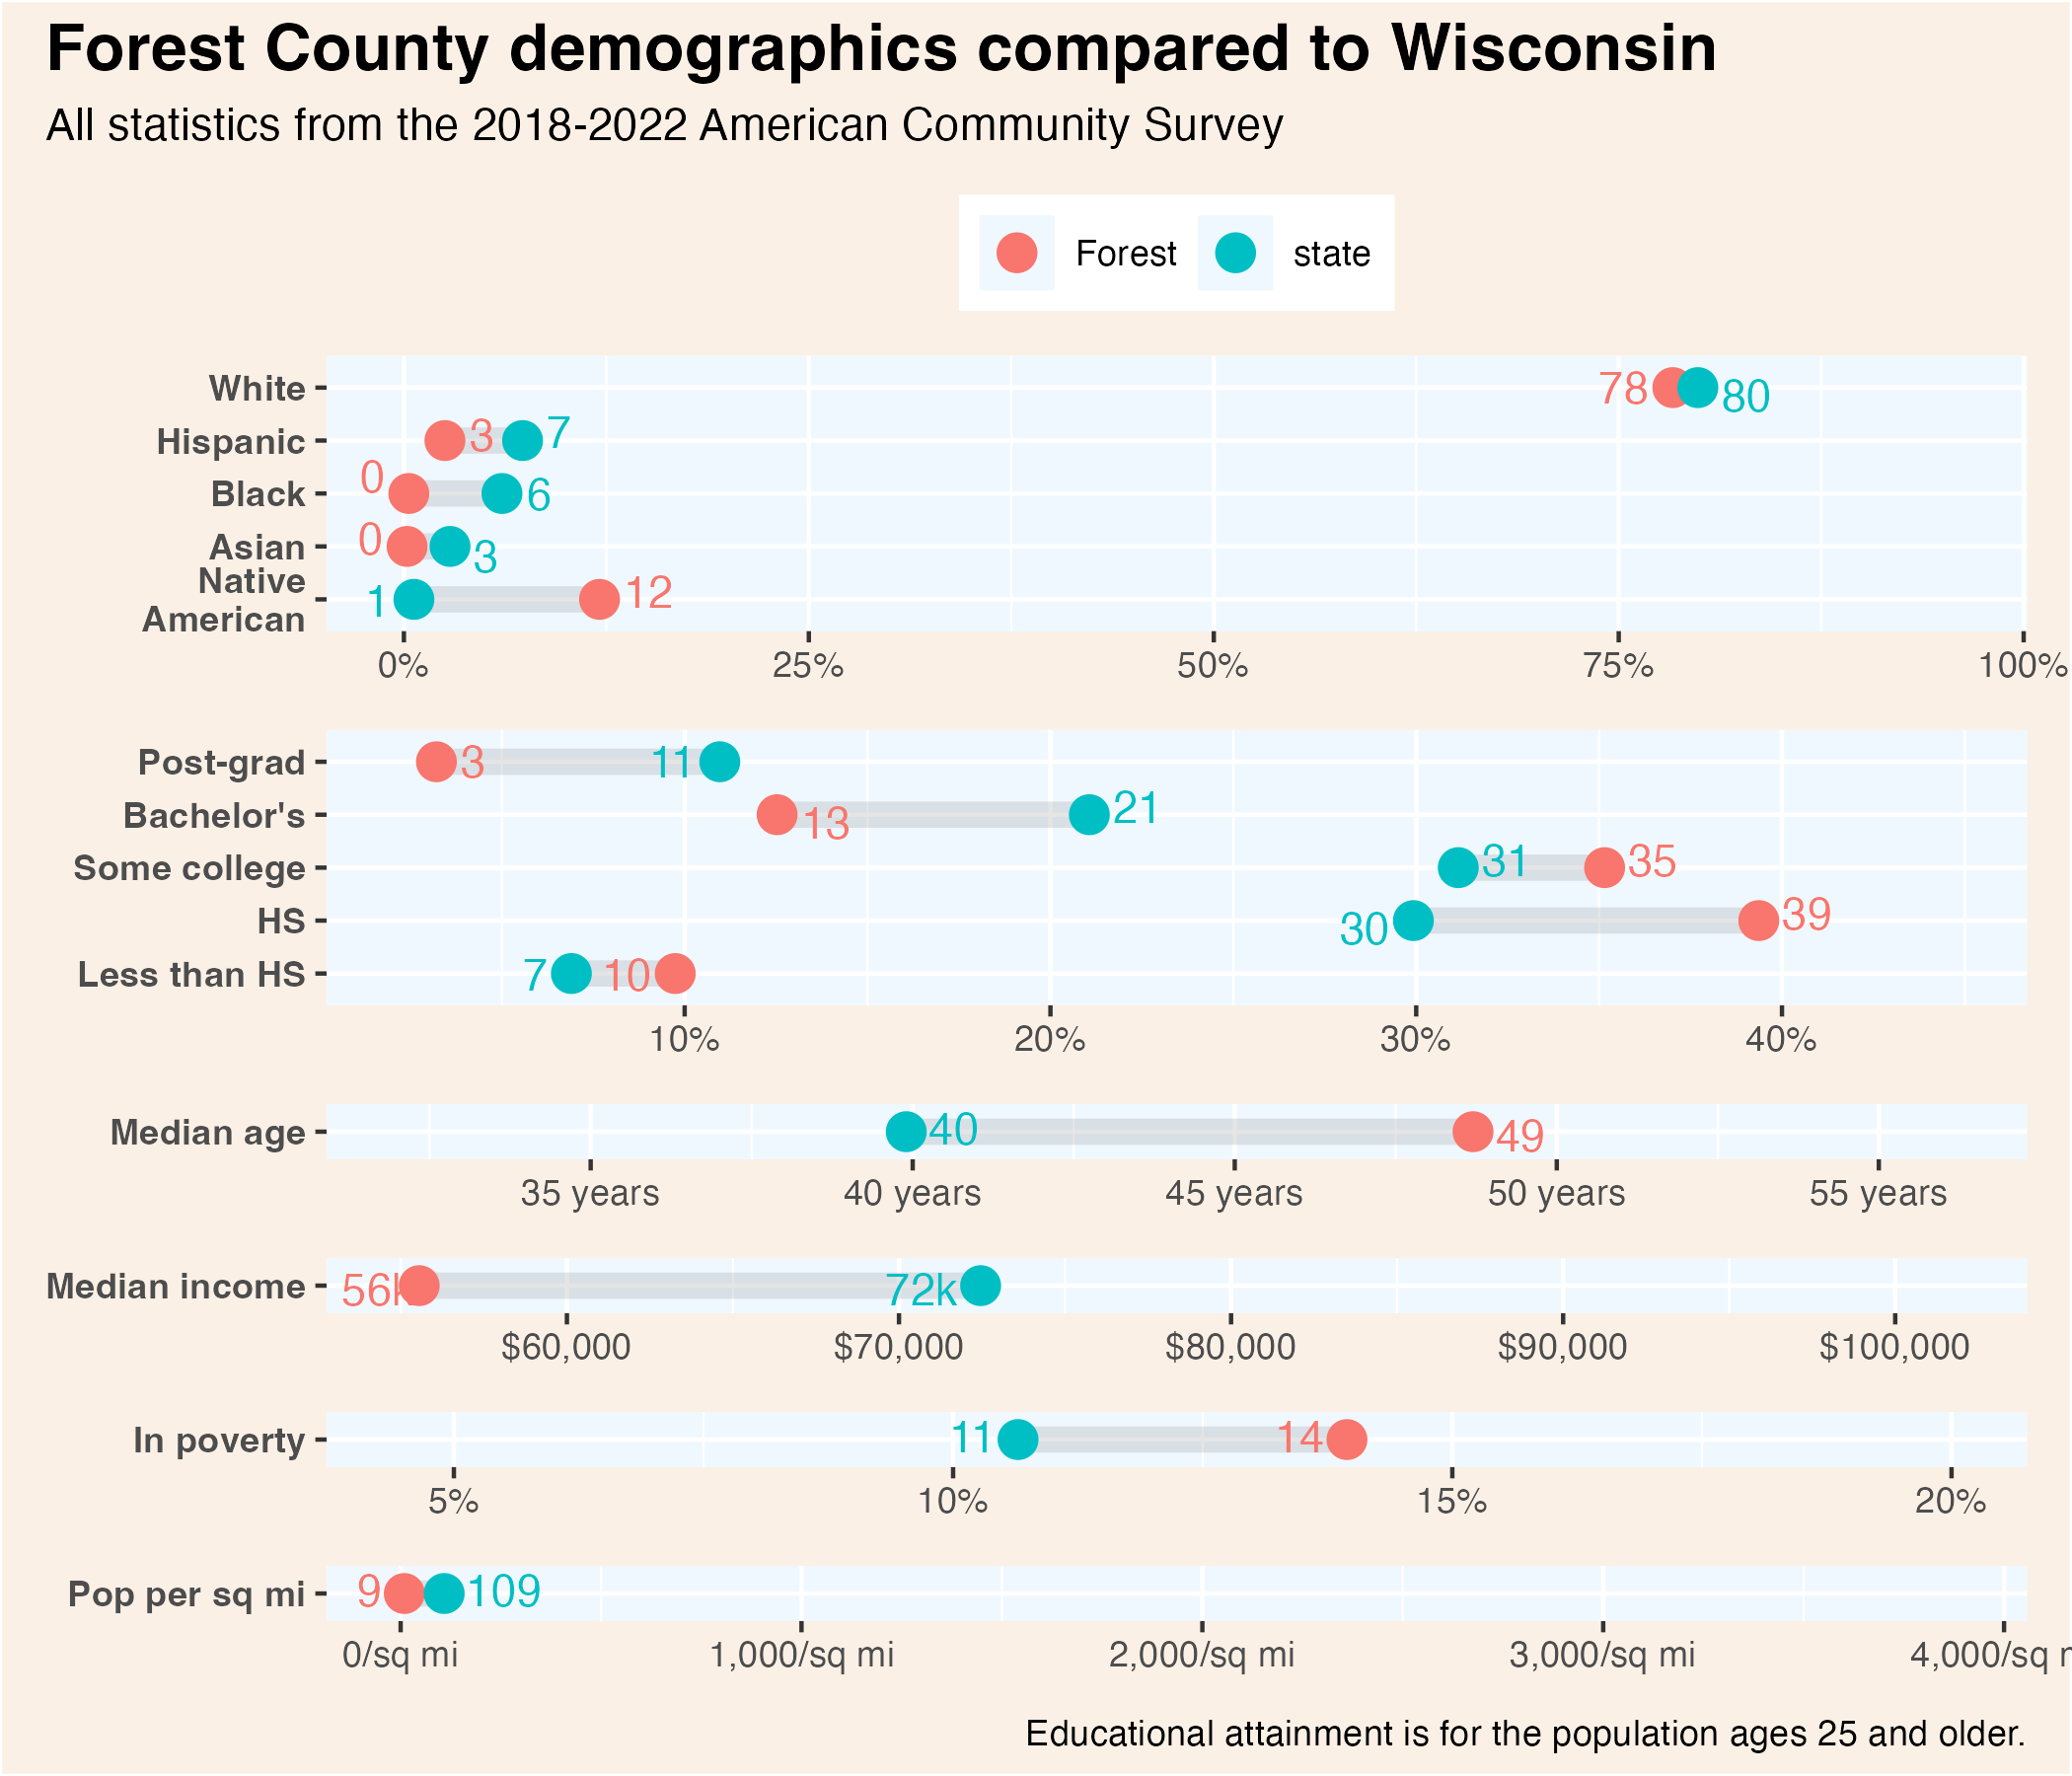
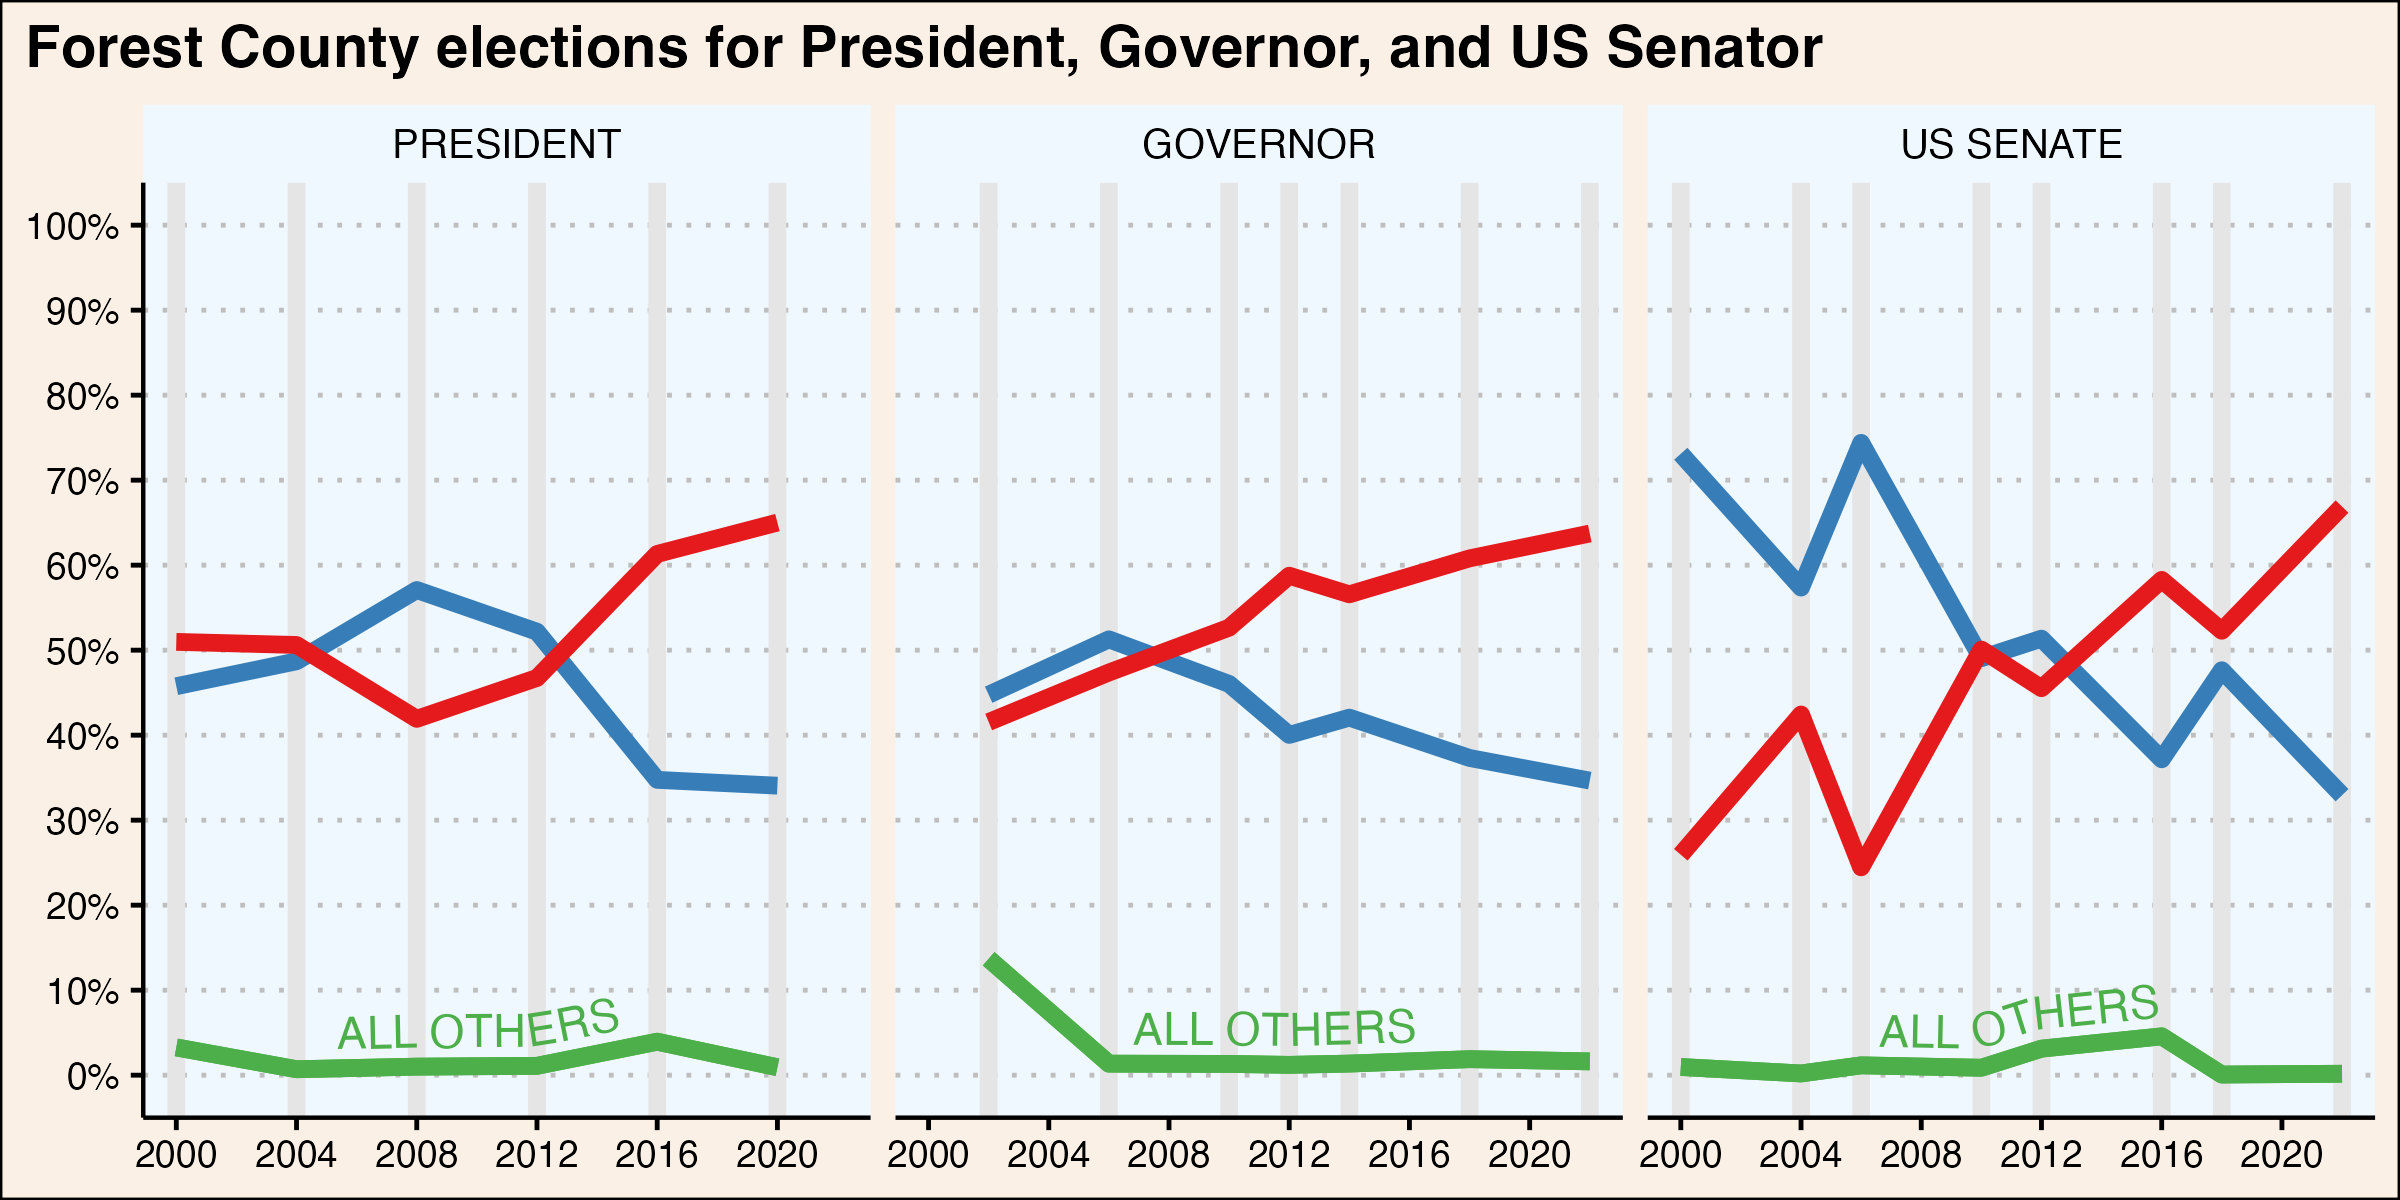
Located along the border with Michigan’s Upper Peninsula, much of Forest County (pop. 9,300) lies within the Chequamegon-Nicolet National Forest. Both the Forest County Potawatomi and the Sokaogon Chippewa tribes hold reservation land in the county, and 11% of the population identifies as Native American alone. Overall, the county’s population is older than the state average, incomes are lower, poverty is higher, and fewer residents have college degrees. Politically, the county, which was competitive between the two parties in the early 2000s, has grown increasingly Republican over the past two decades.
23.1 Demographics
23.2 County Election Results
Click each column name to sort its values.
23.3 Municipality Election Results
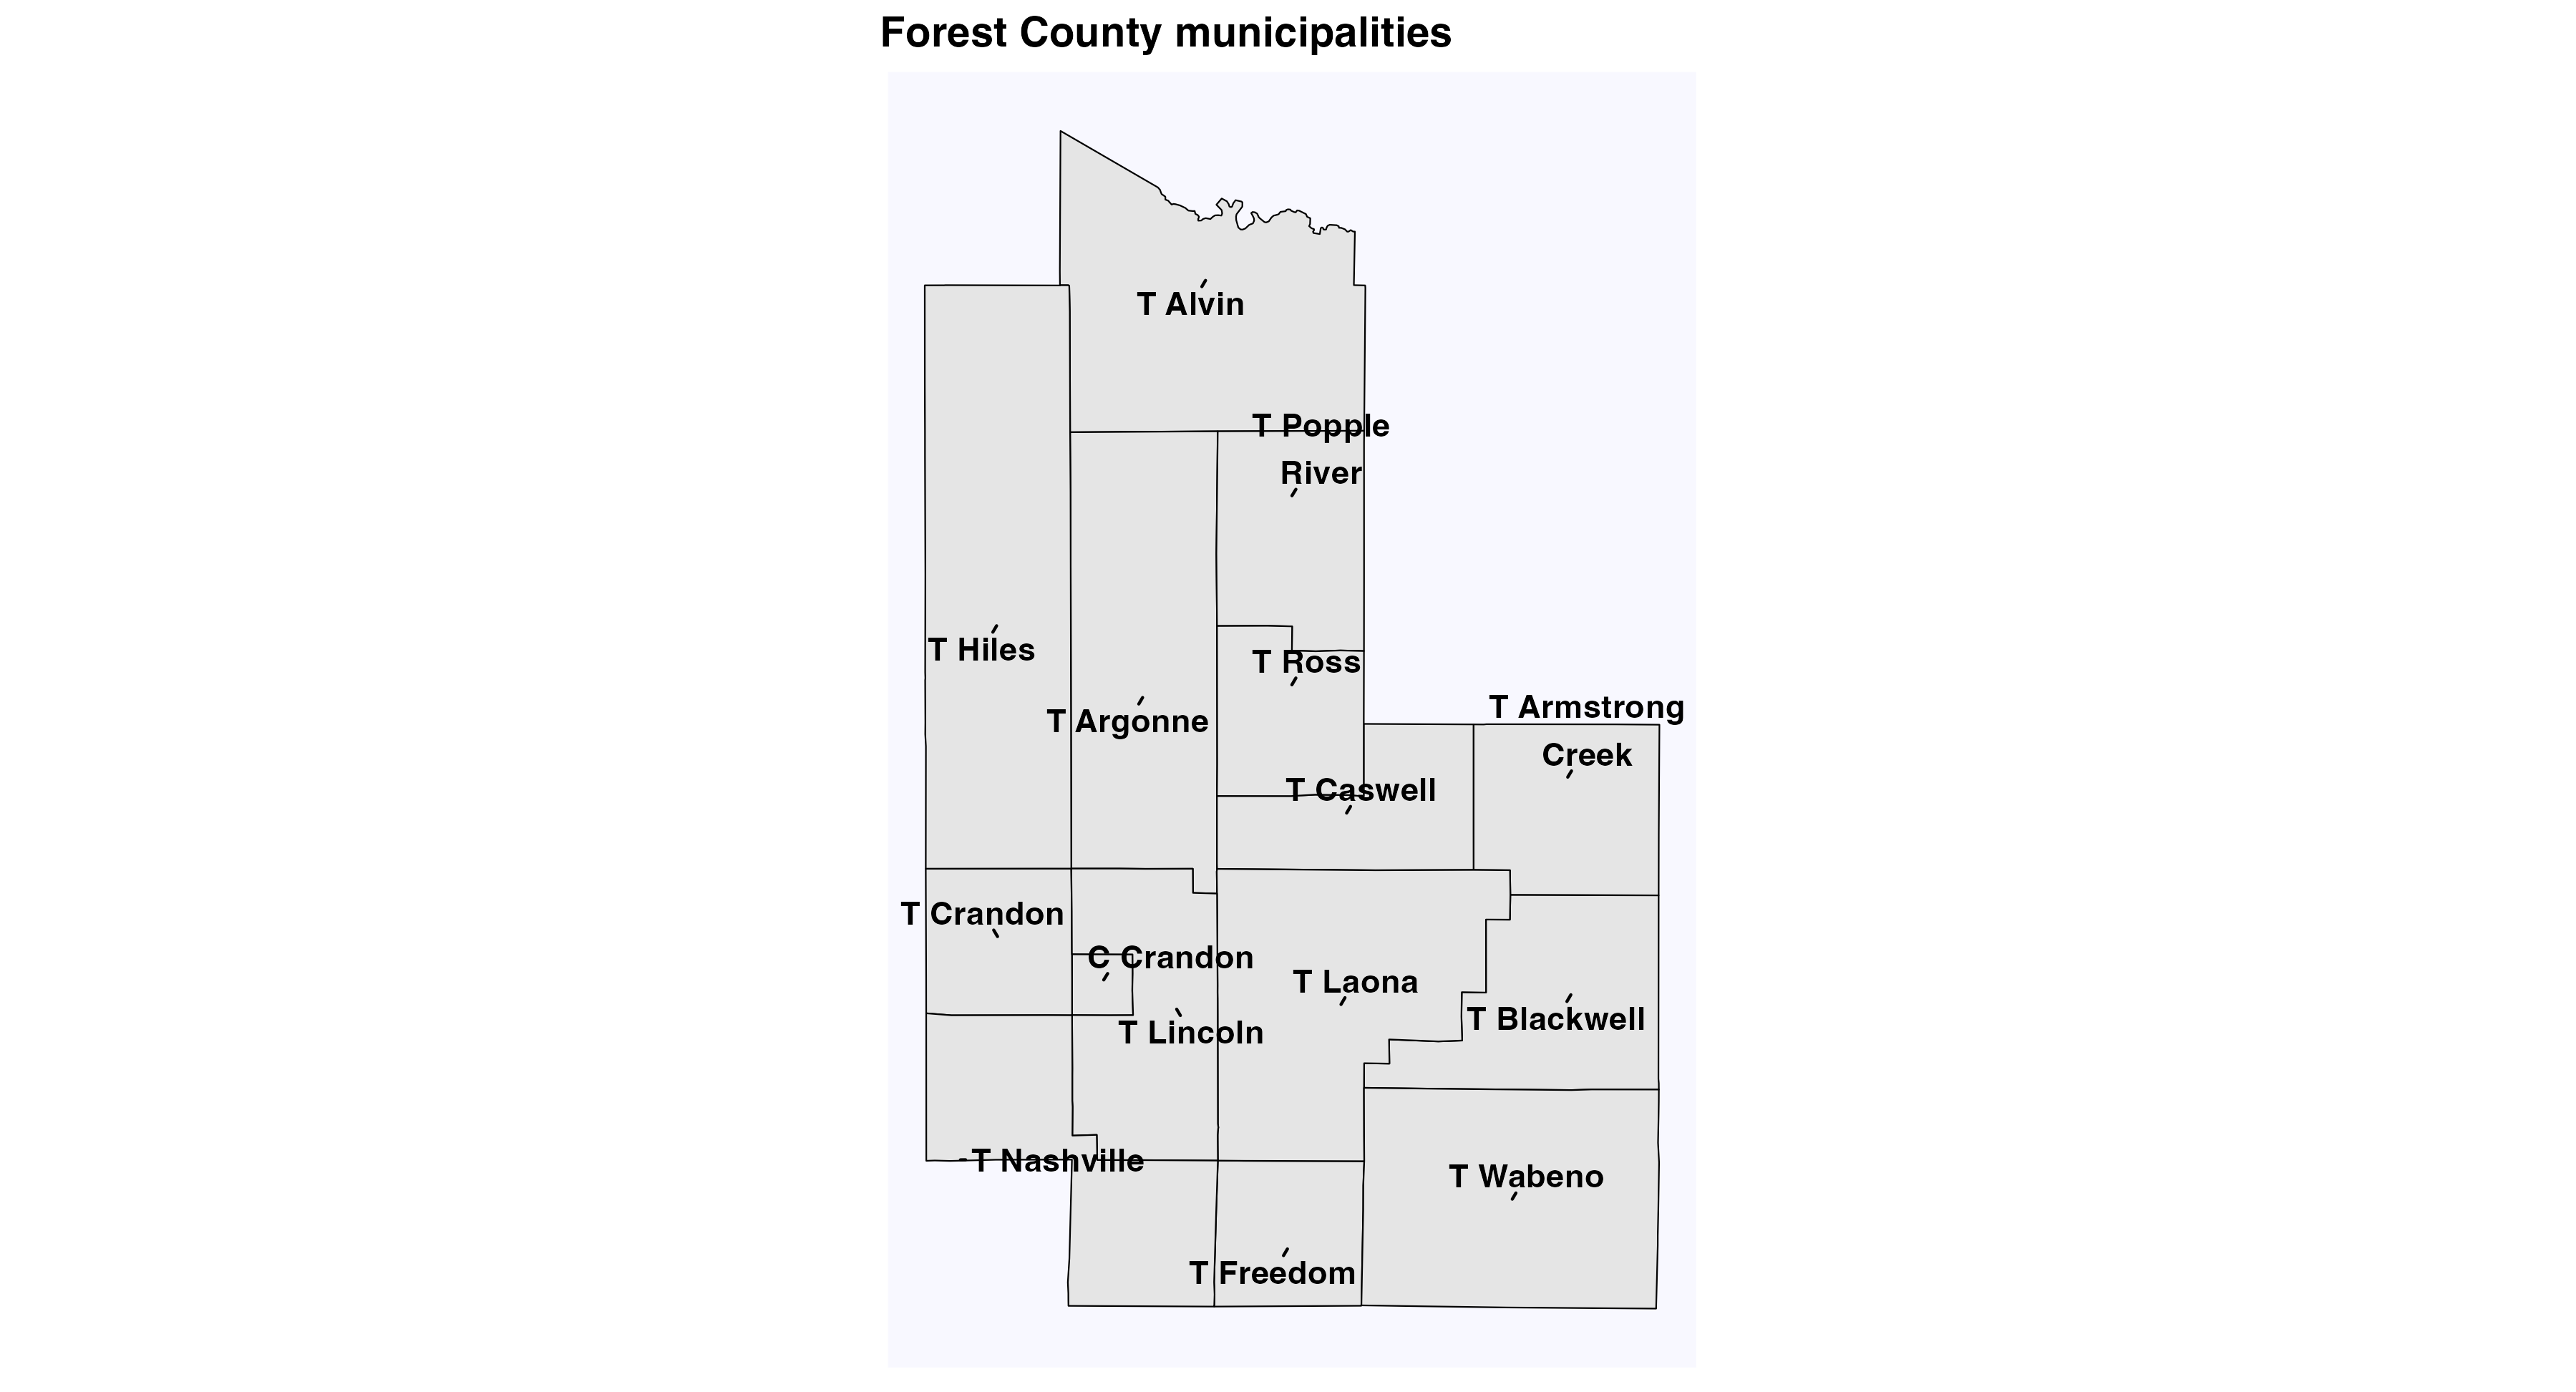
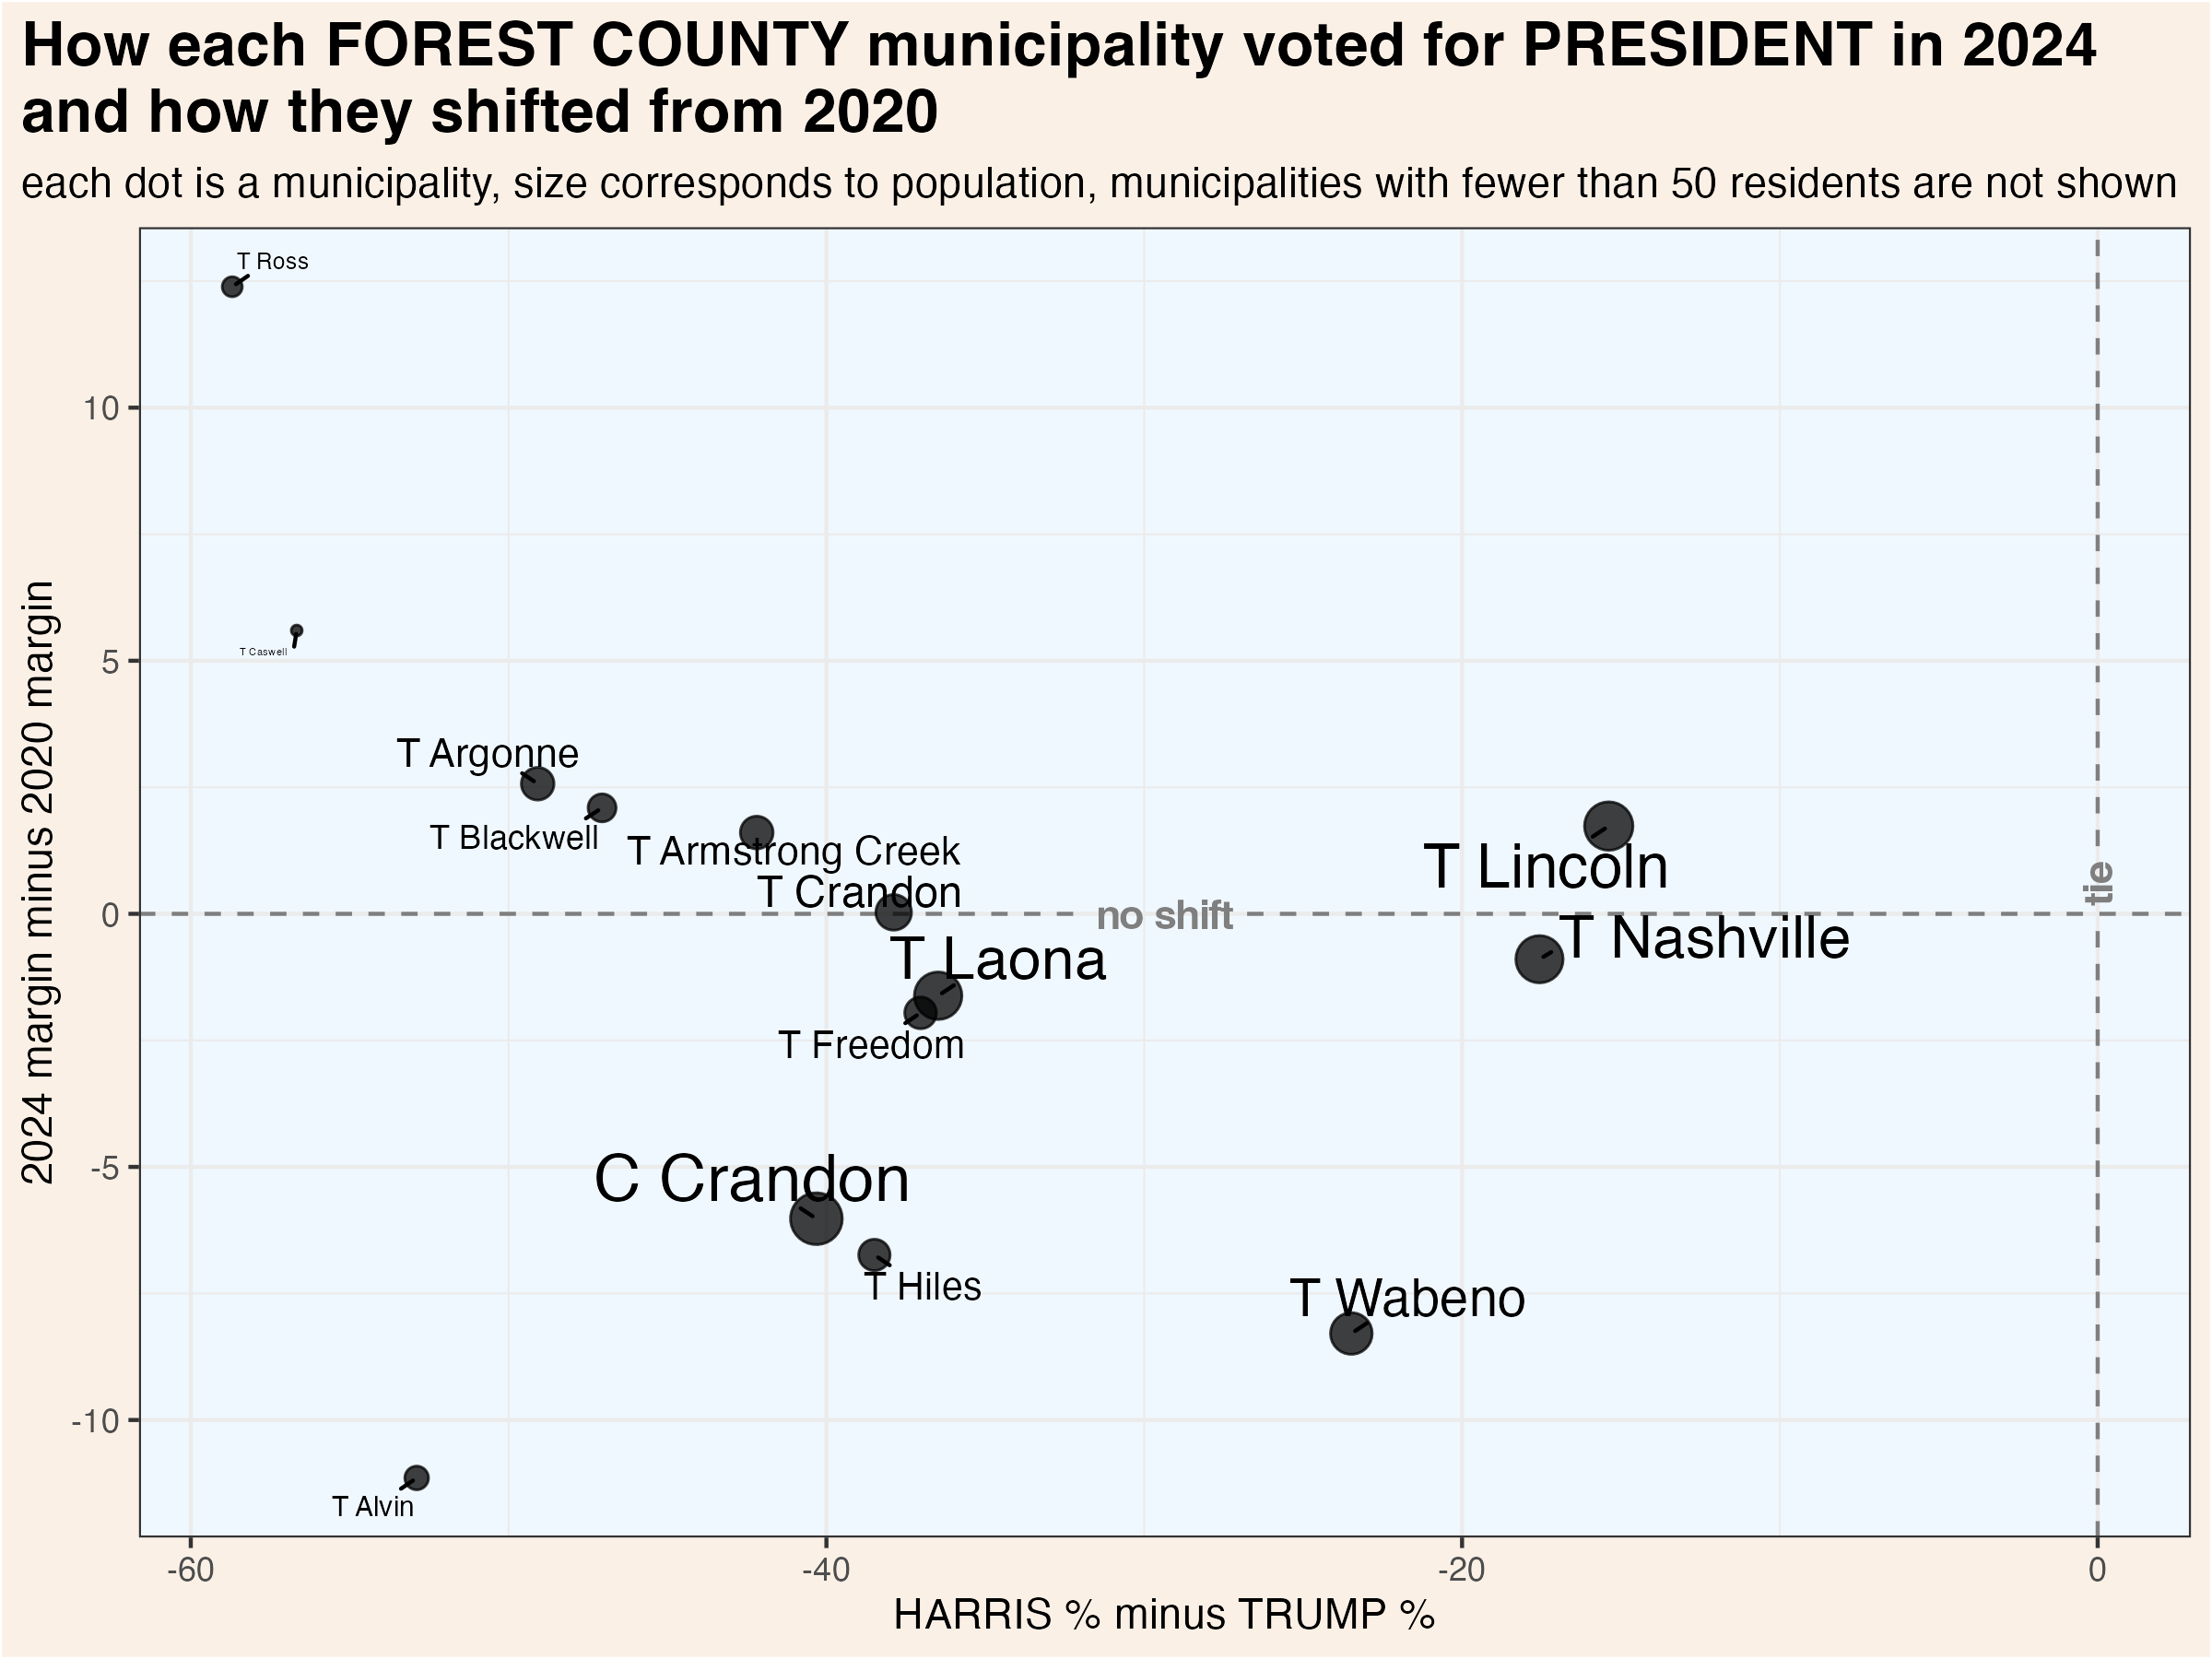
All municipalities in Forest County lean Republican, and most gave Trump a higher share of the vote in 2020 than 2016. The two communities with the highest Native American population share, the towns of Nashville and Lincoln, are among the most politically competitive.
This map shows the location of each municipality in the county, as it existed in 2022.
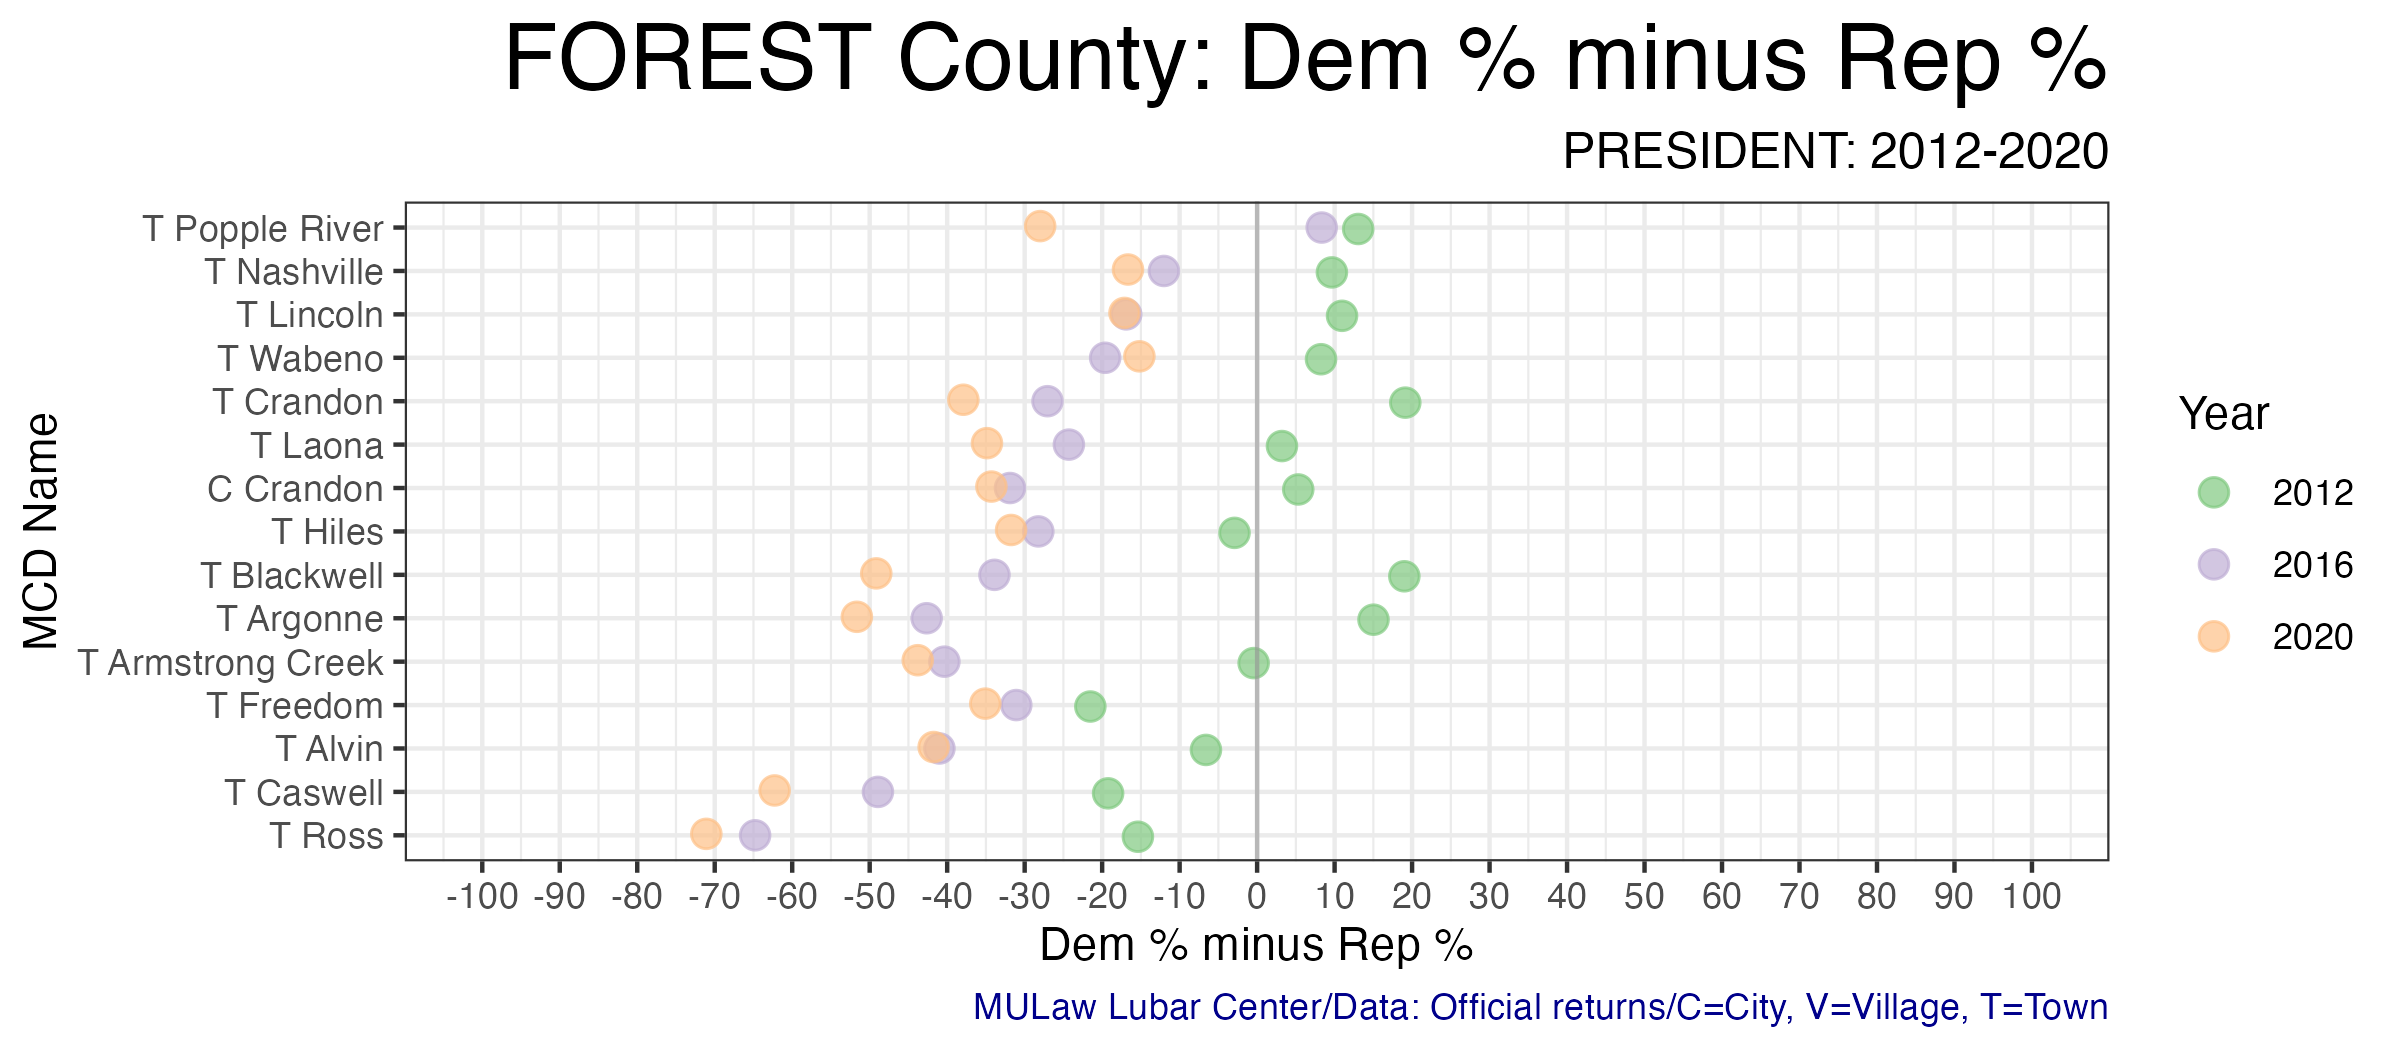
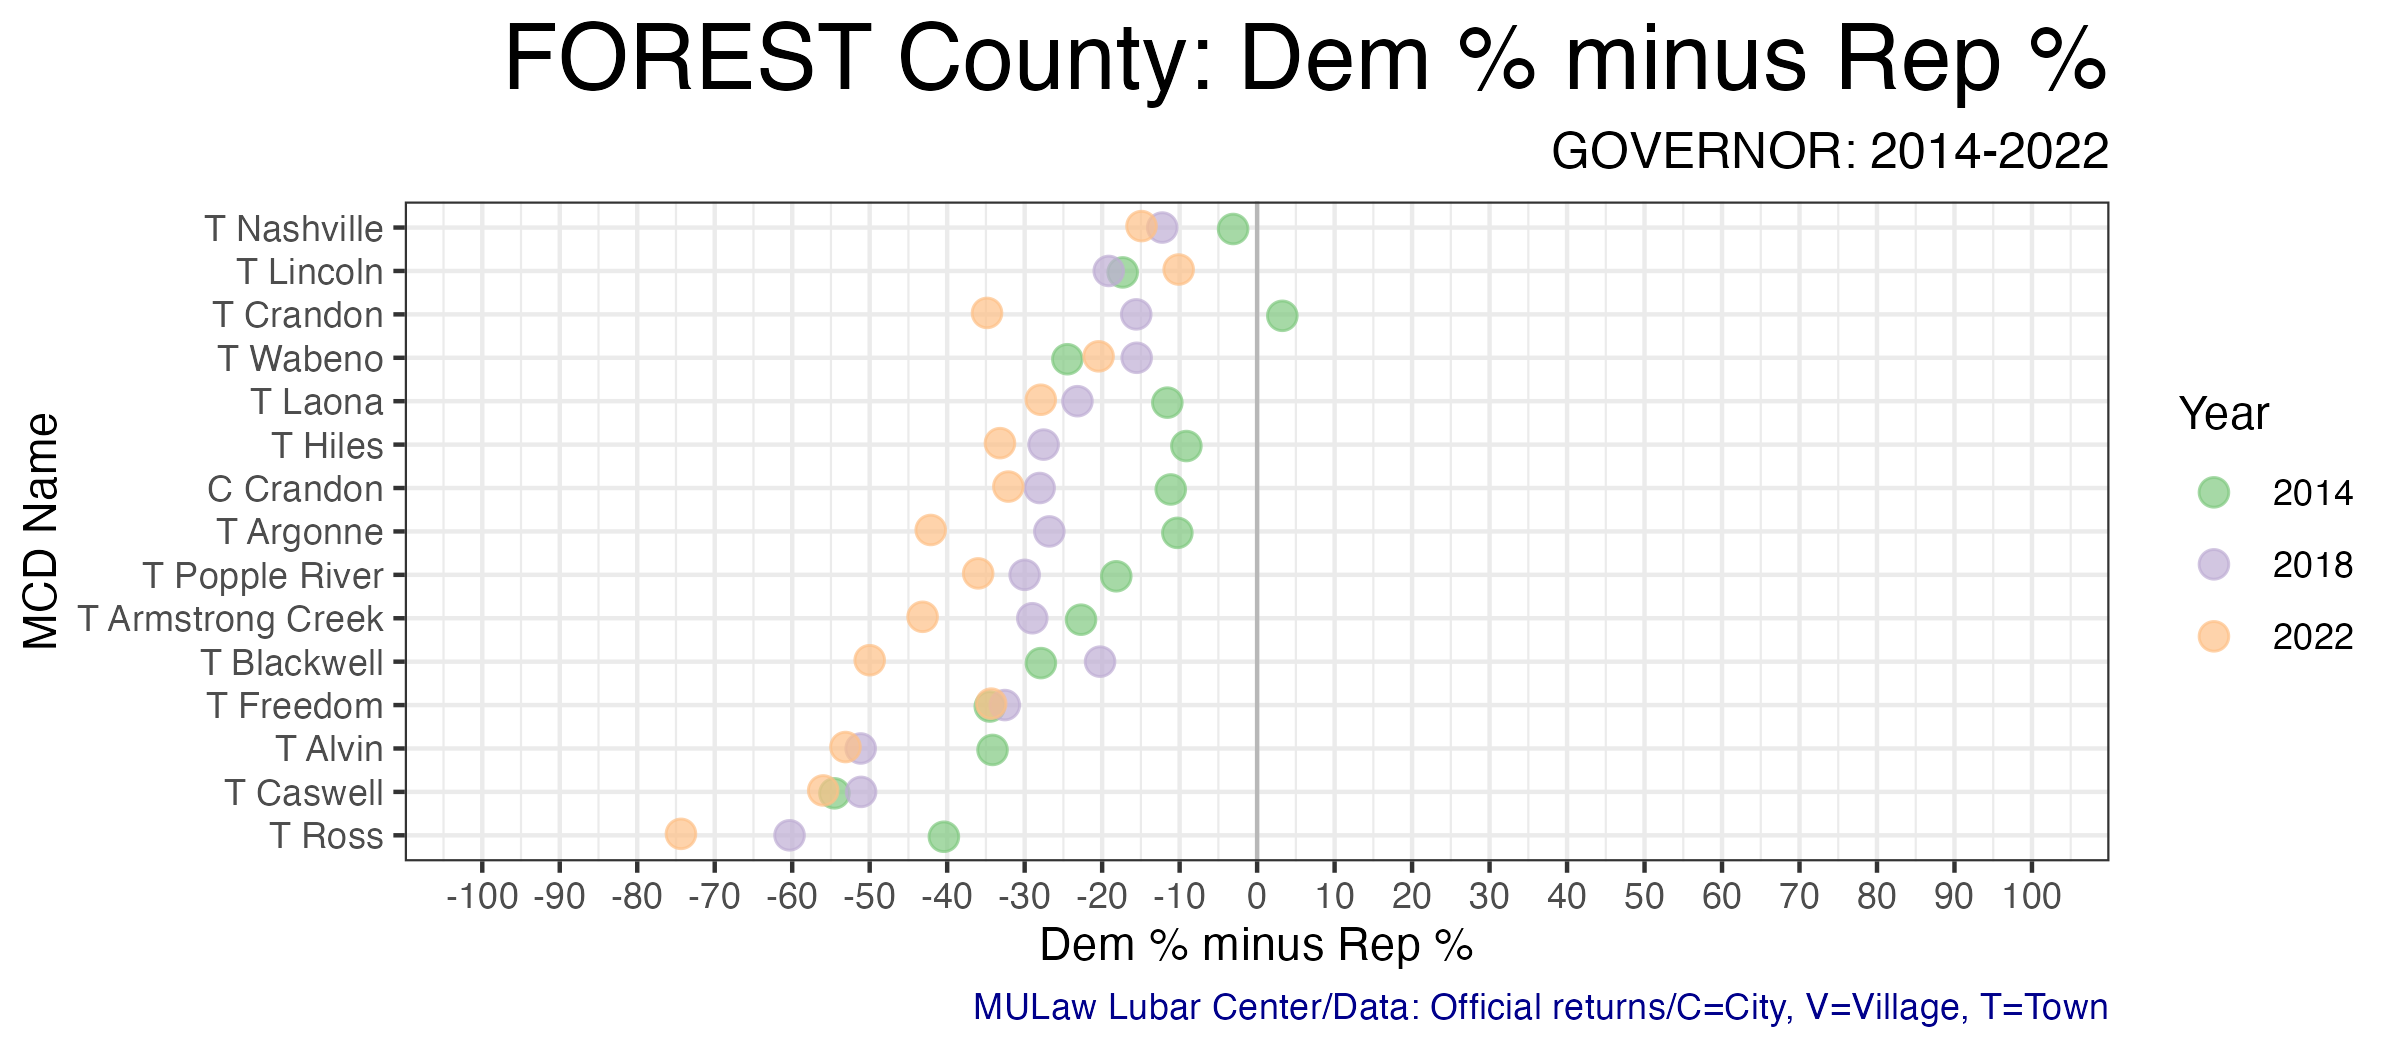
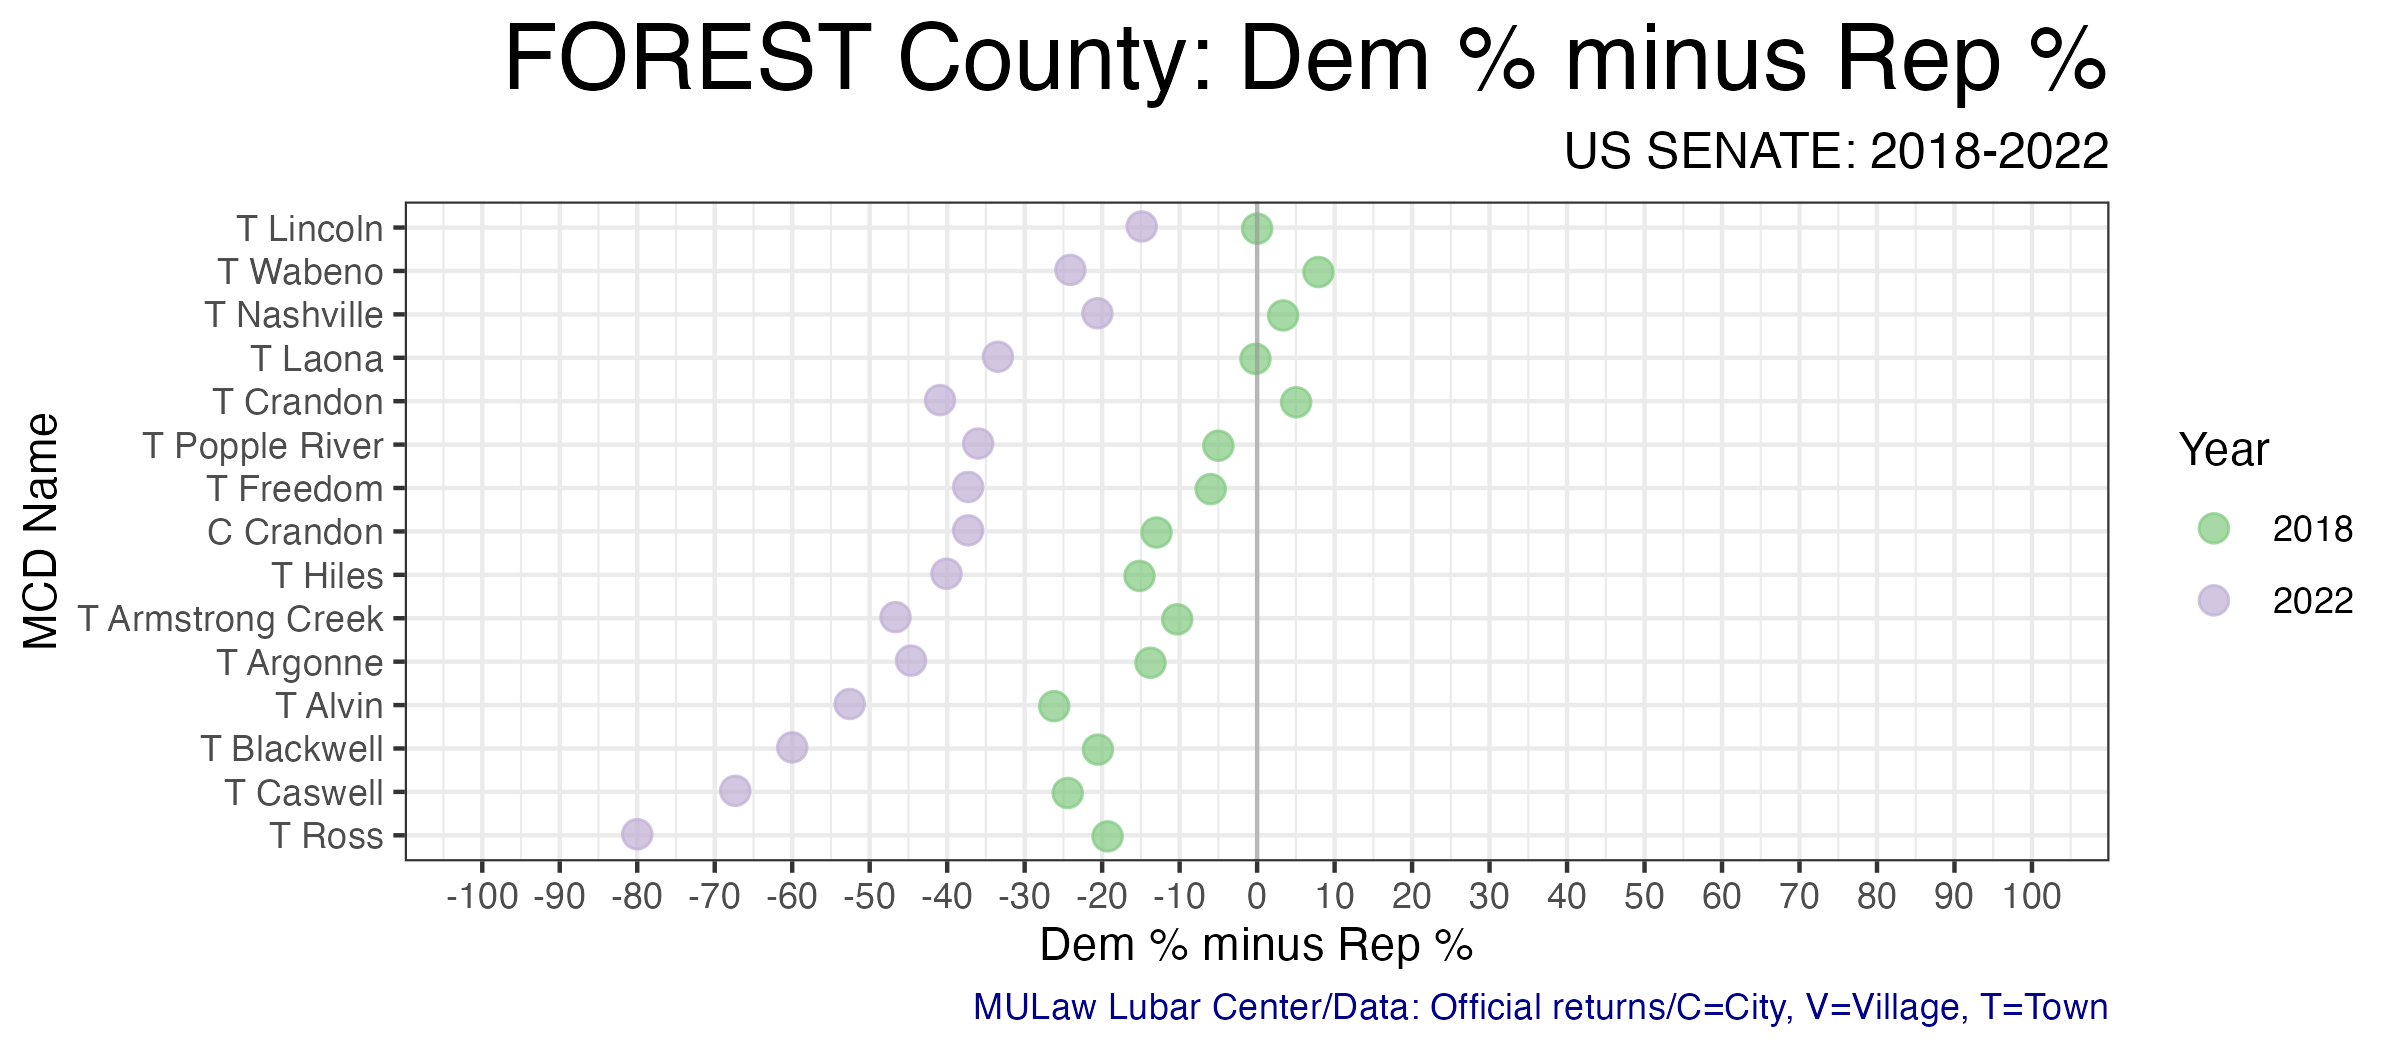
These dot plots show the most recent election results in each municipality.
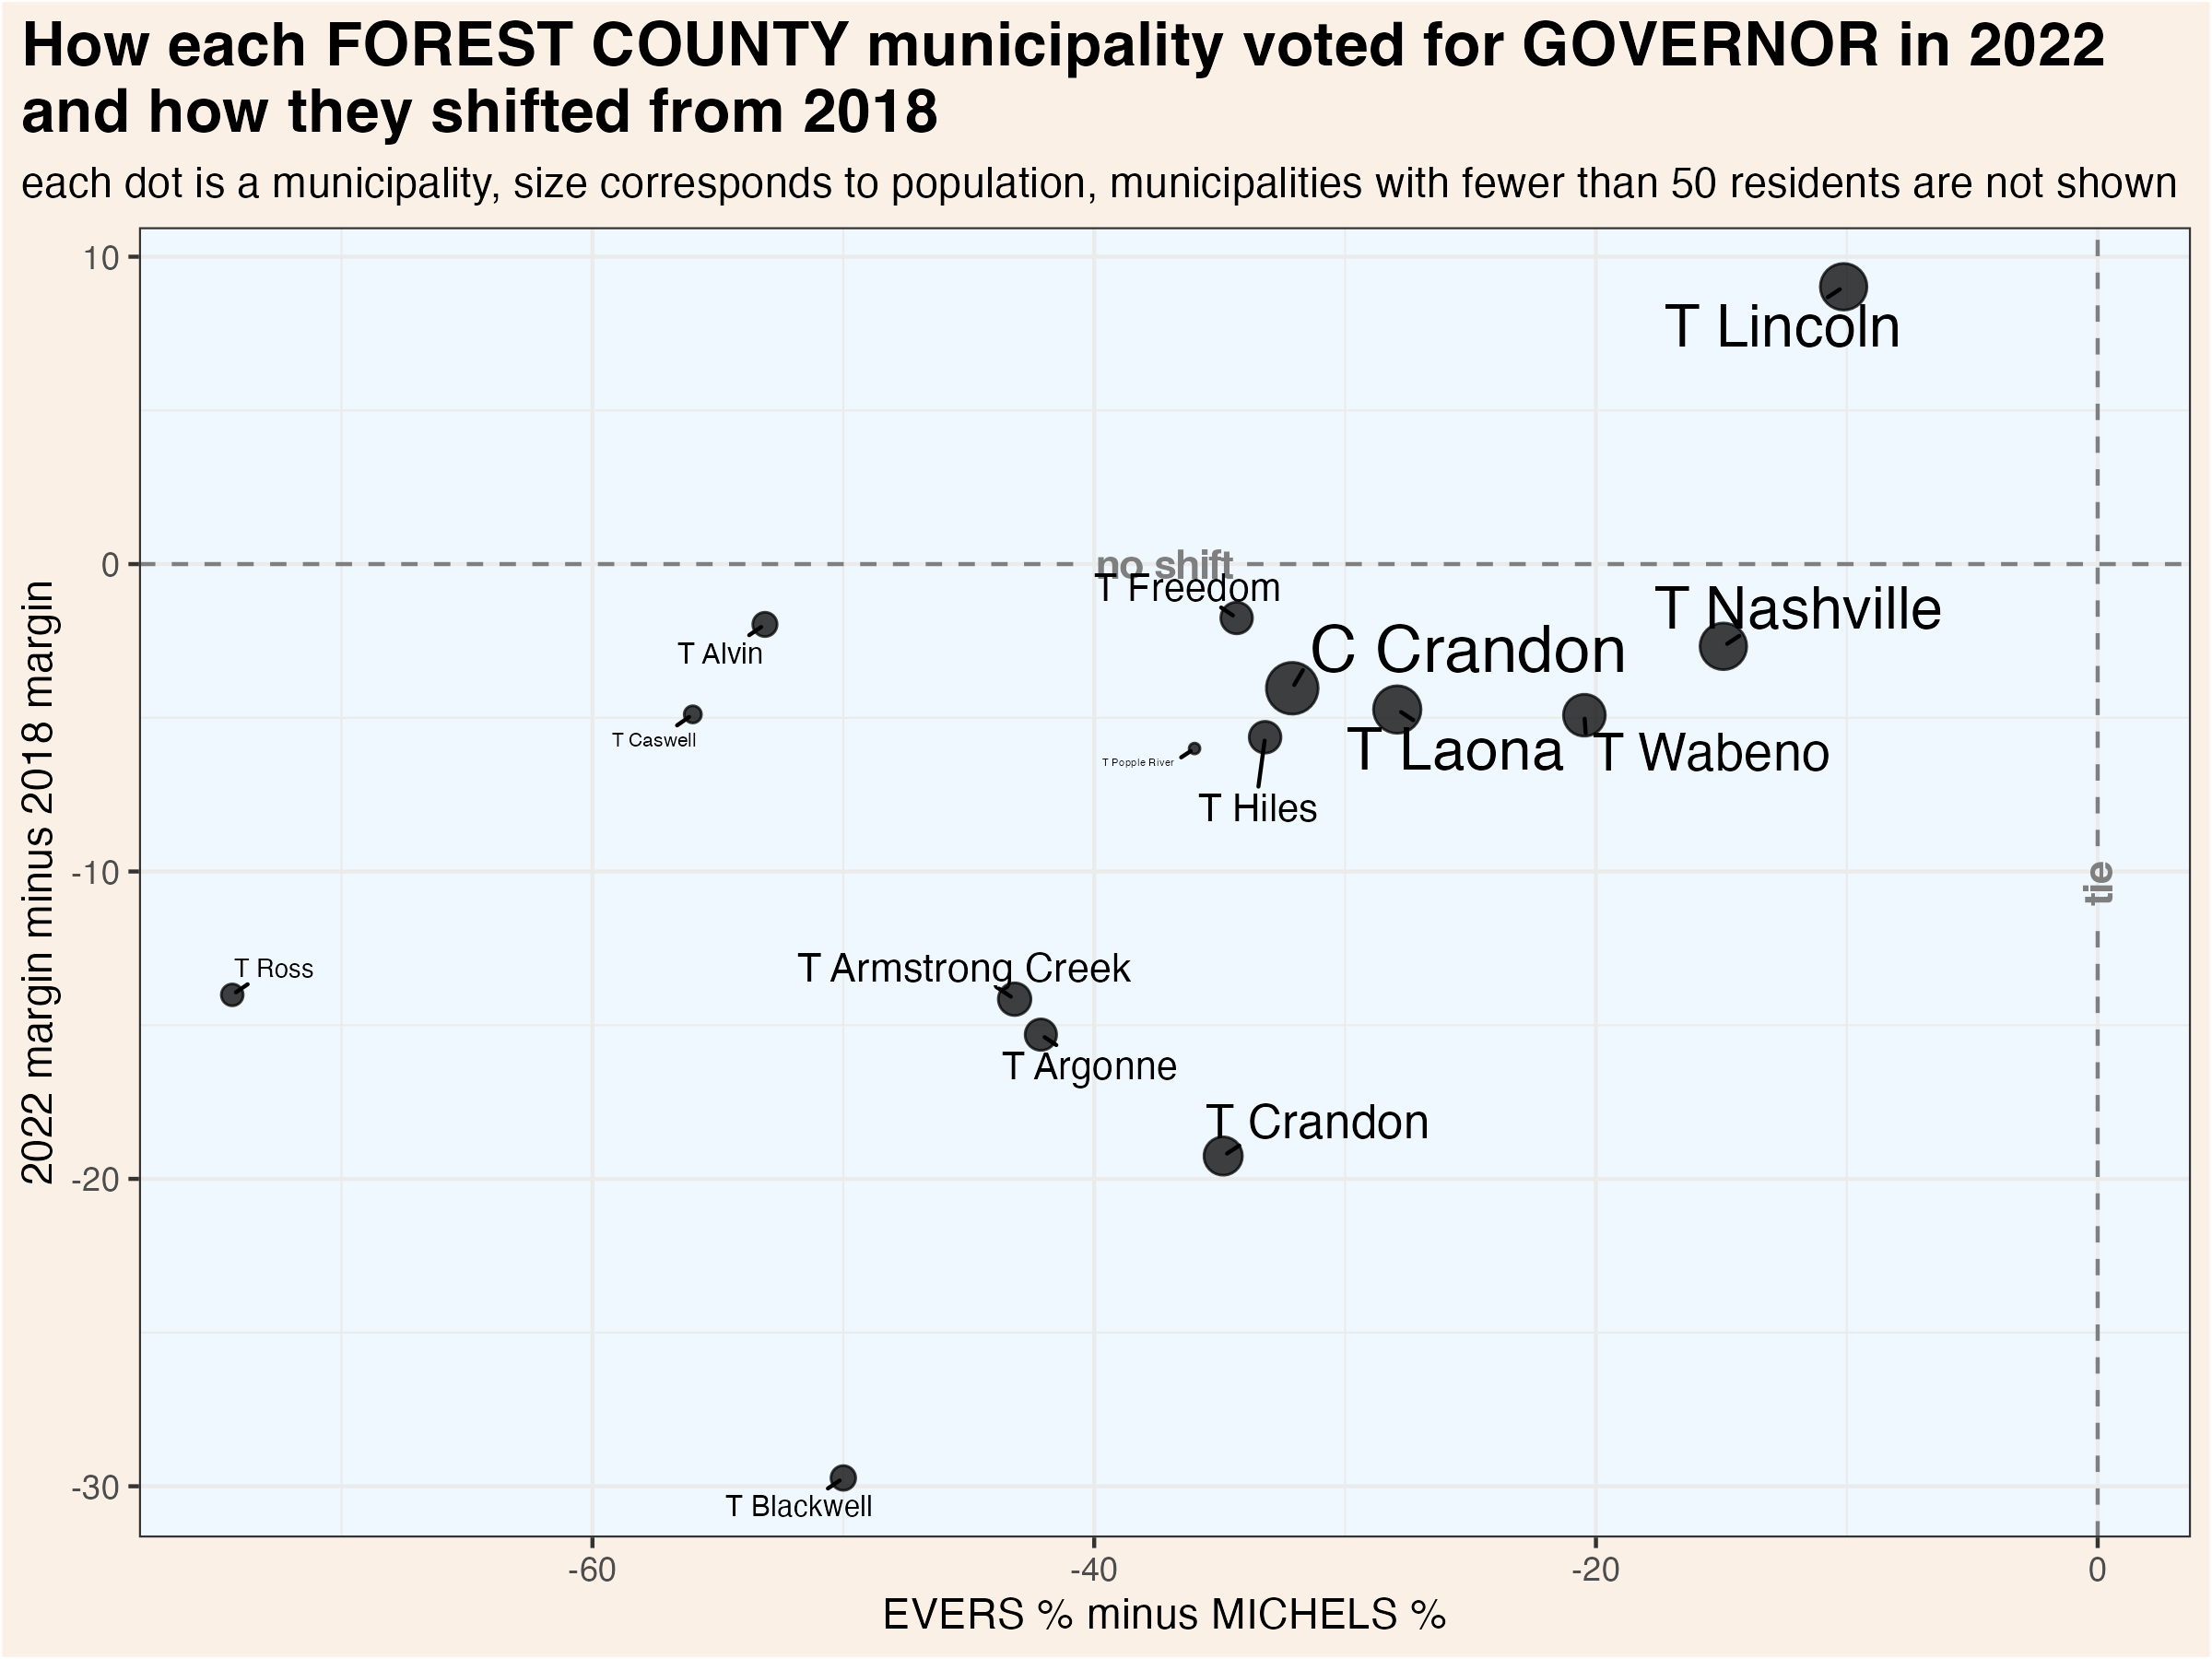
To more clearly illustrate recent changes in municipality voting trends, these scatterplots compare the most recent vote for president and senator with the shift from that office’s previous election.
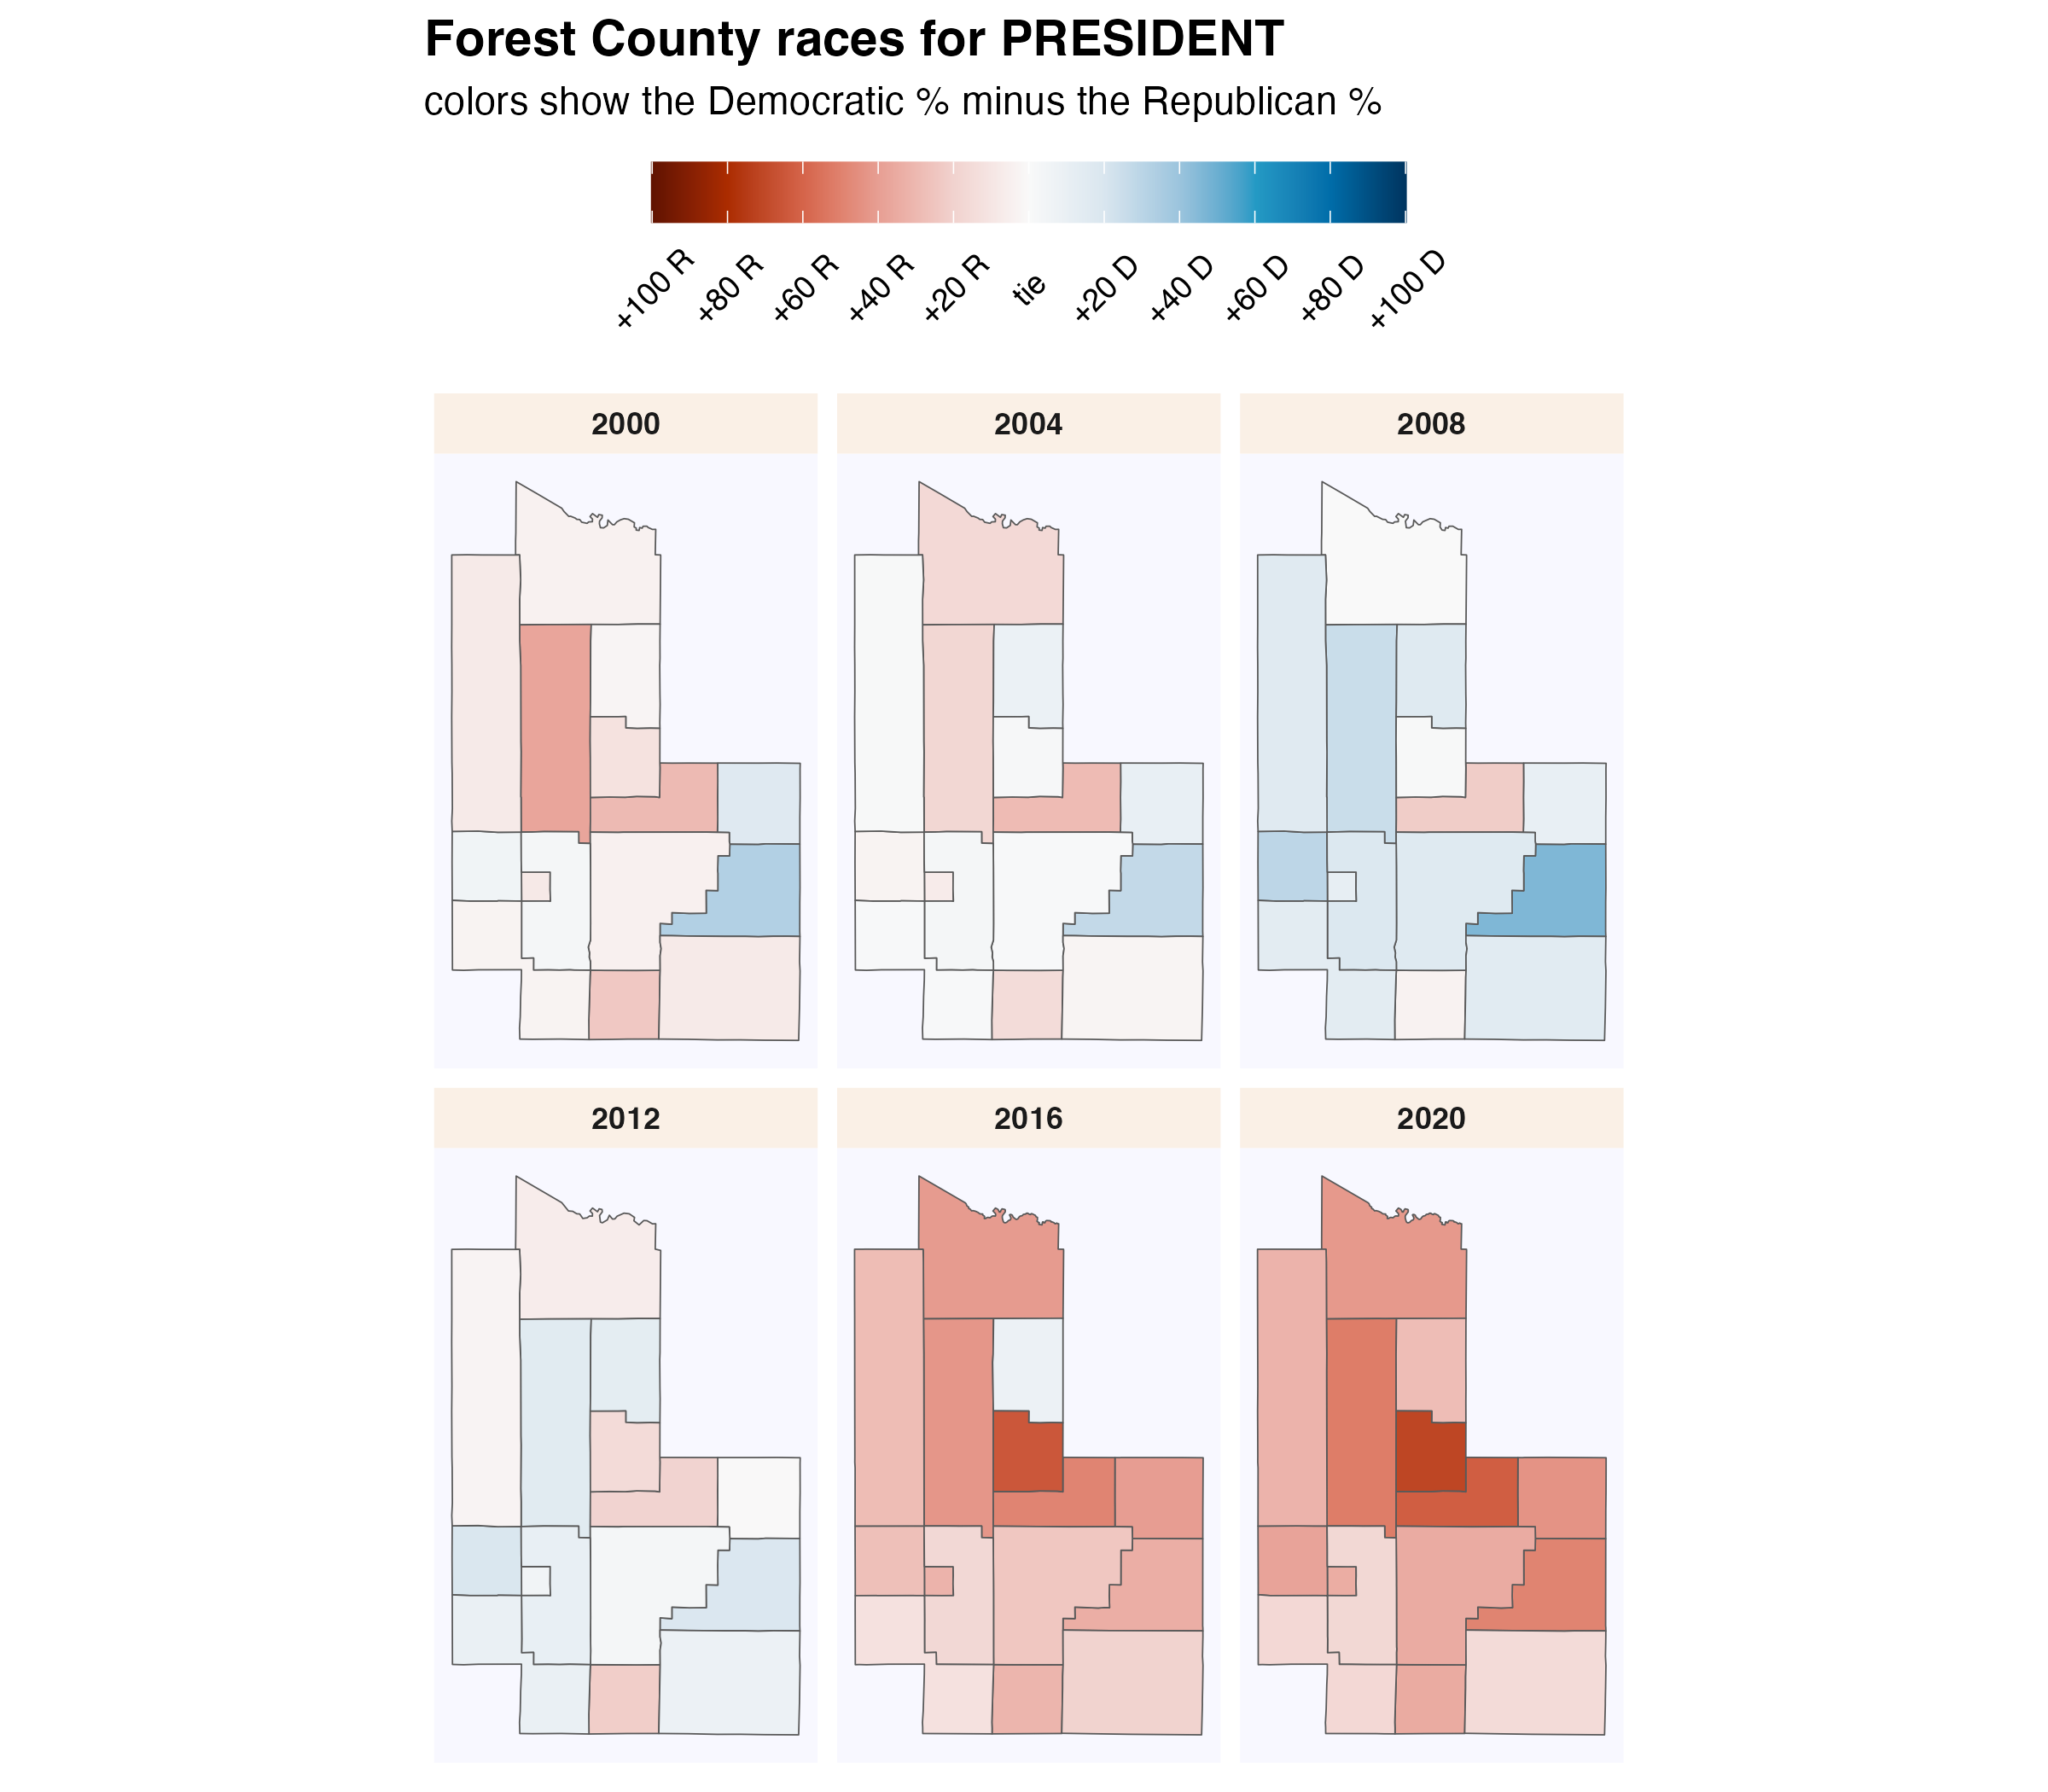
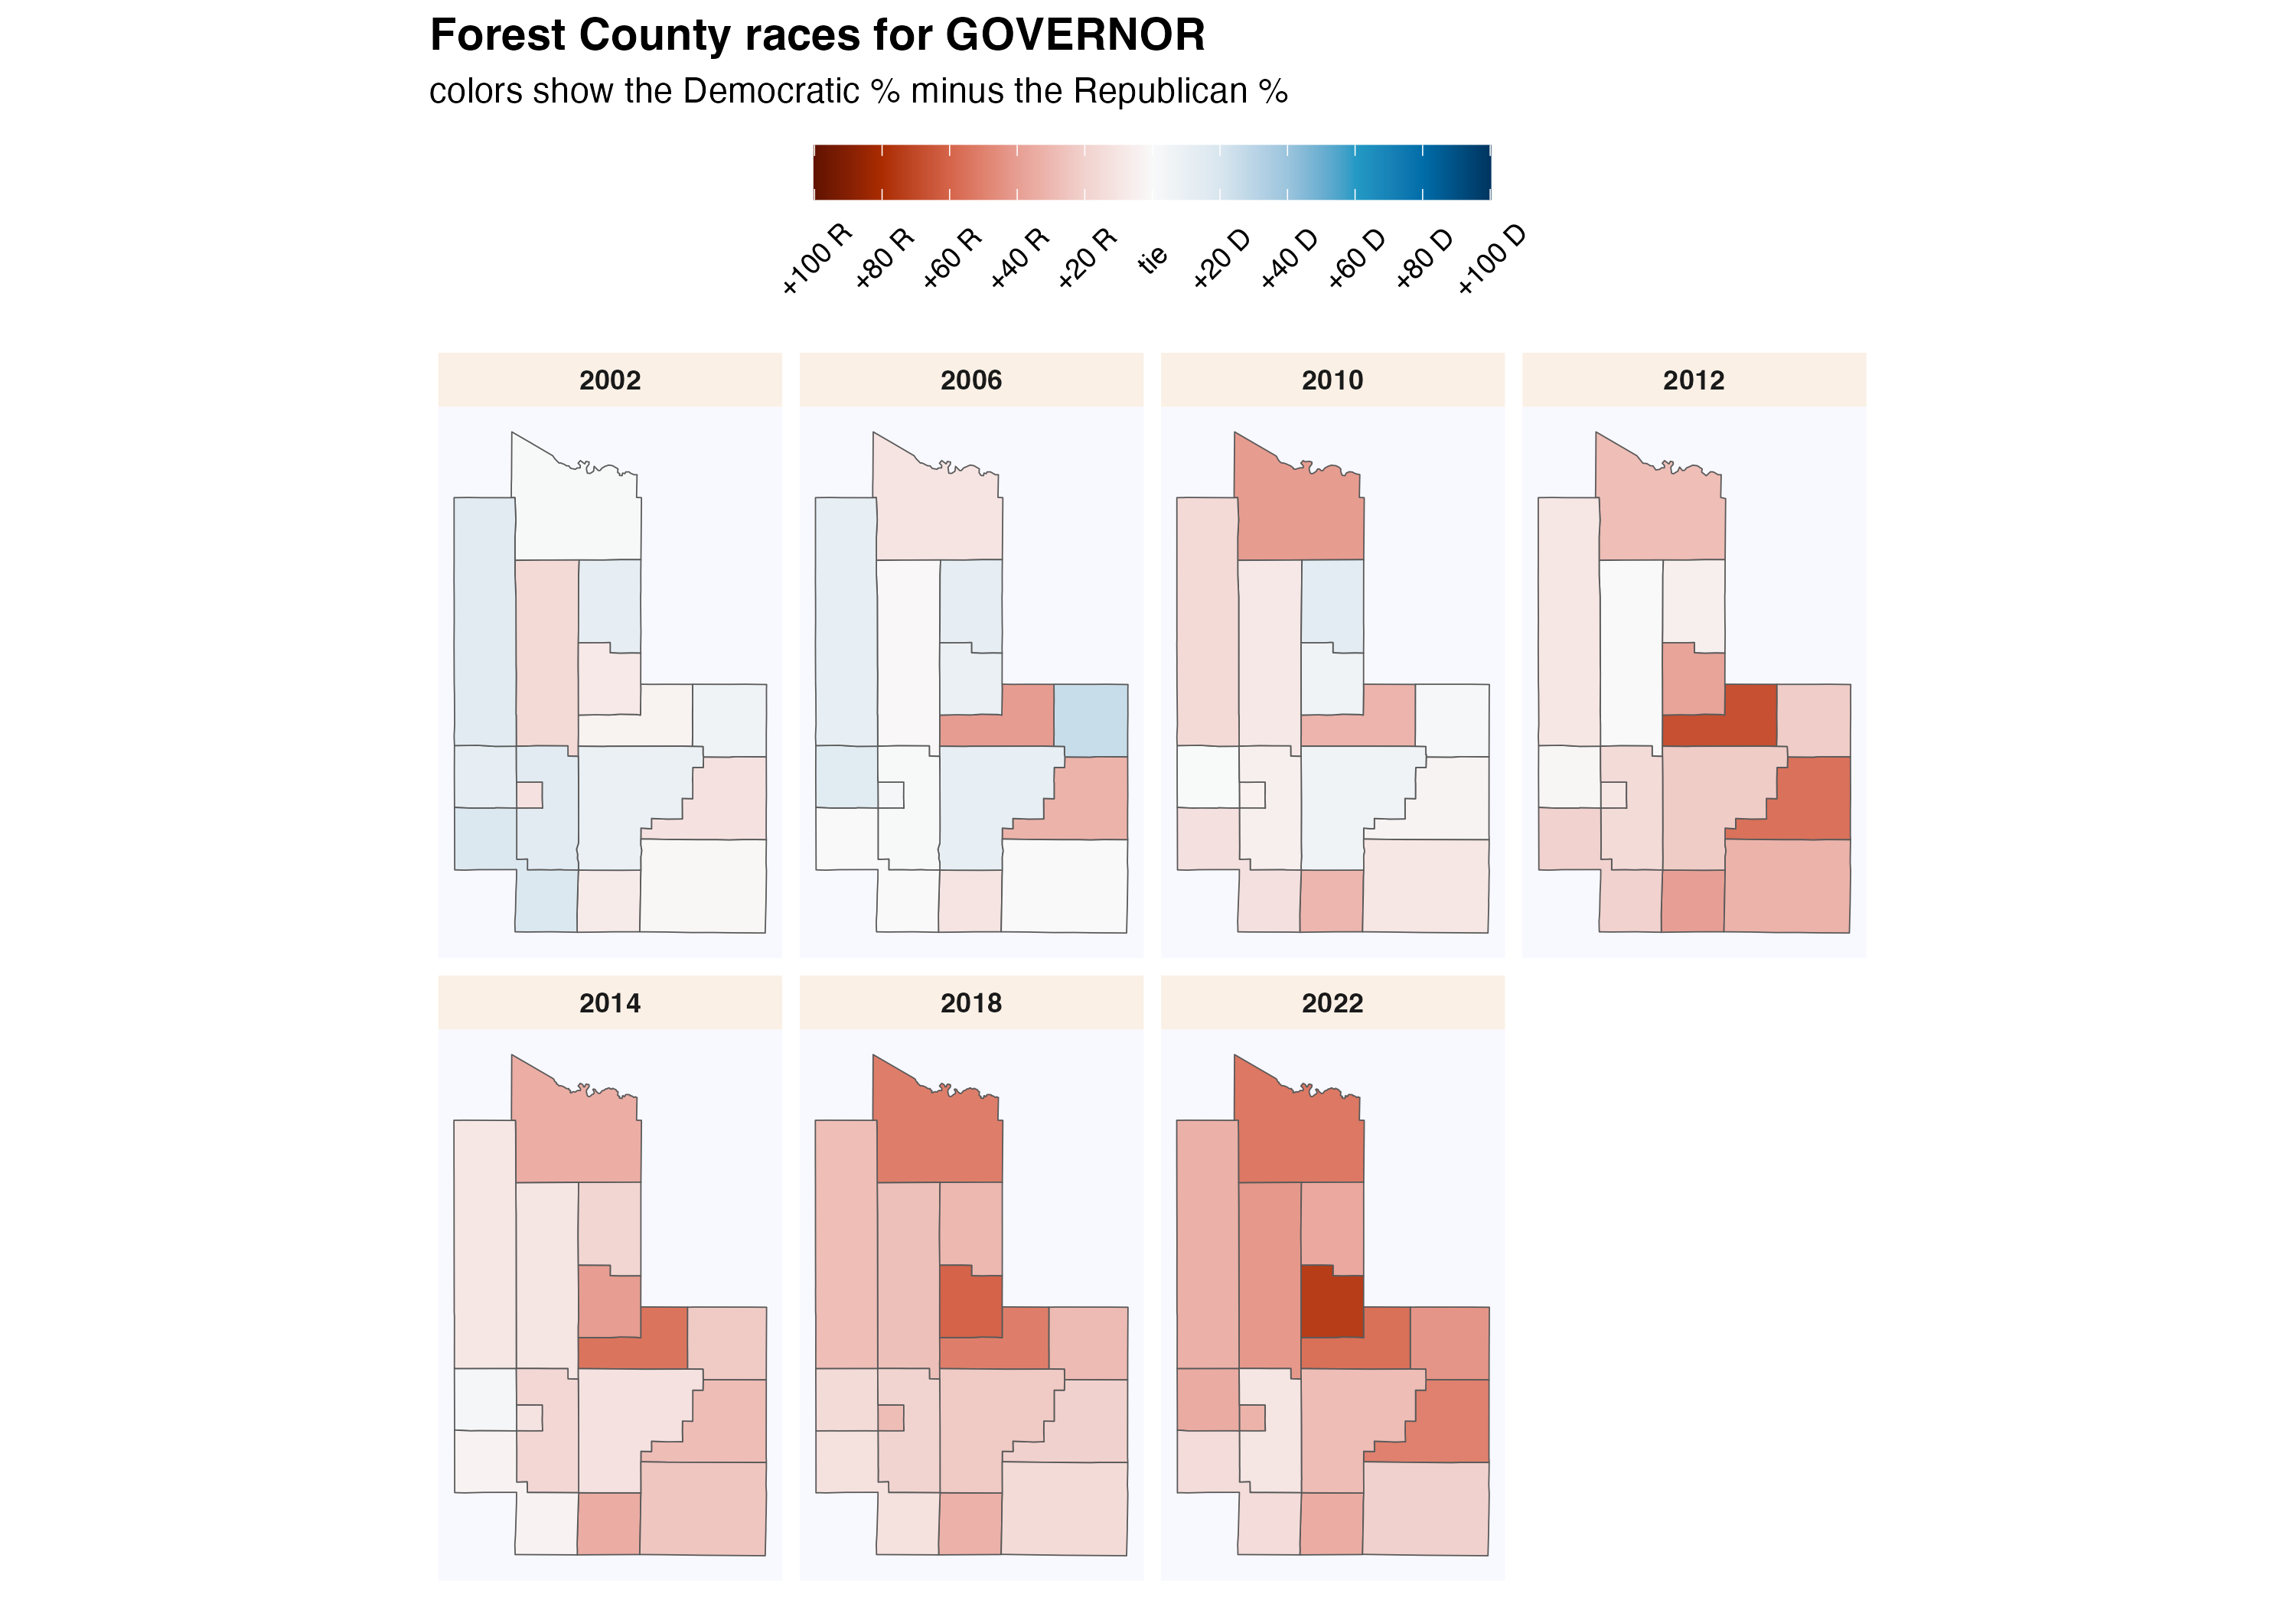
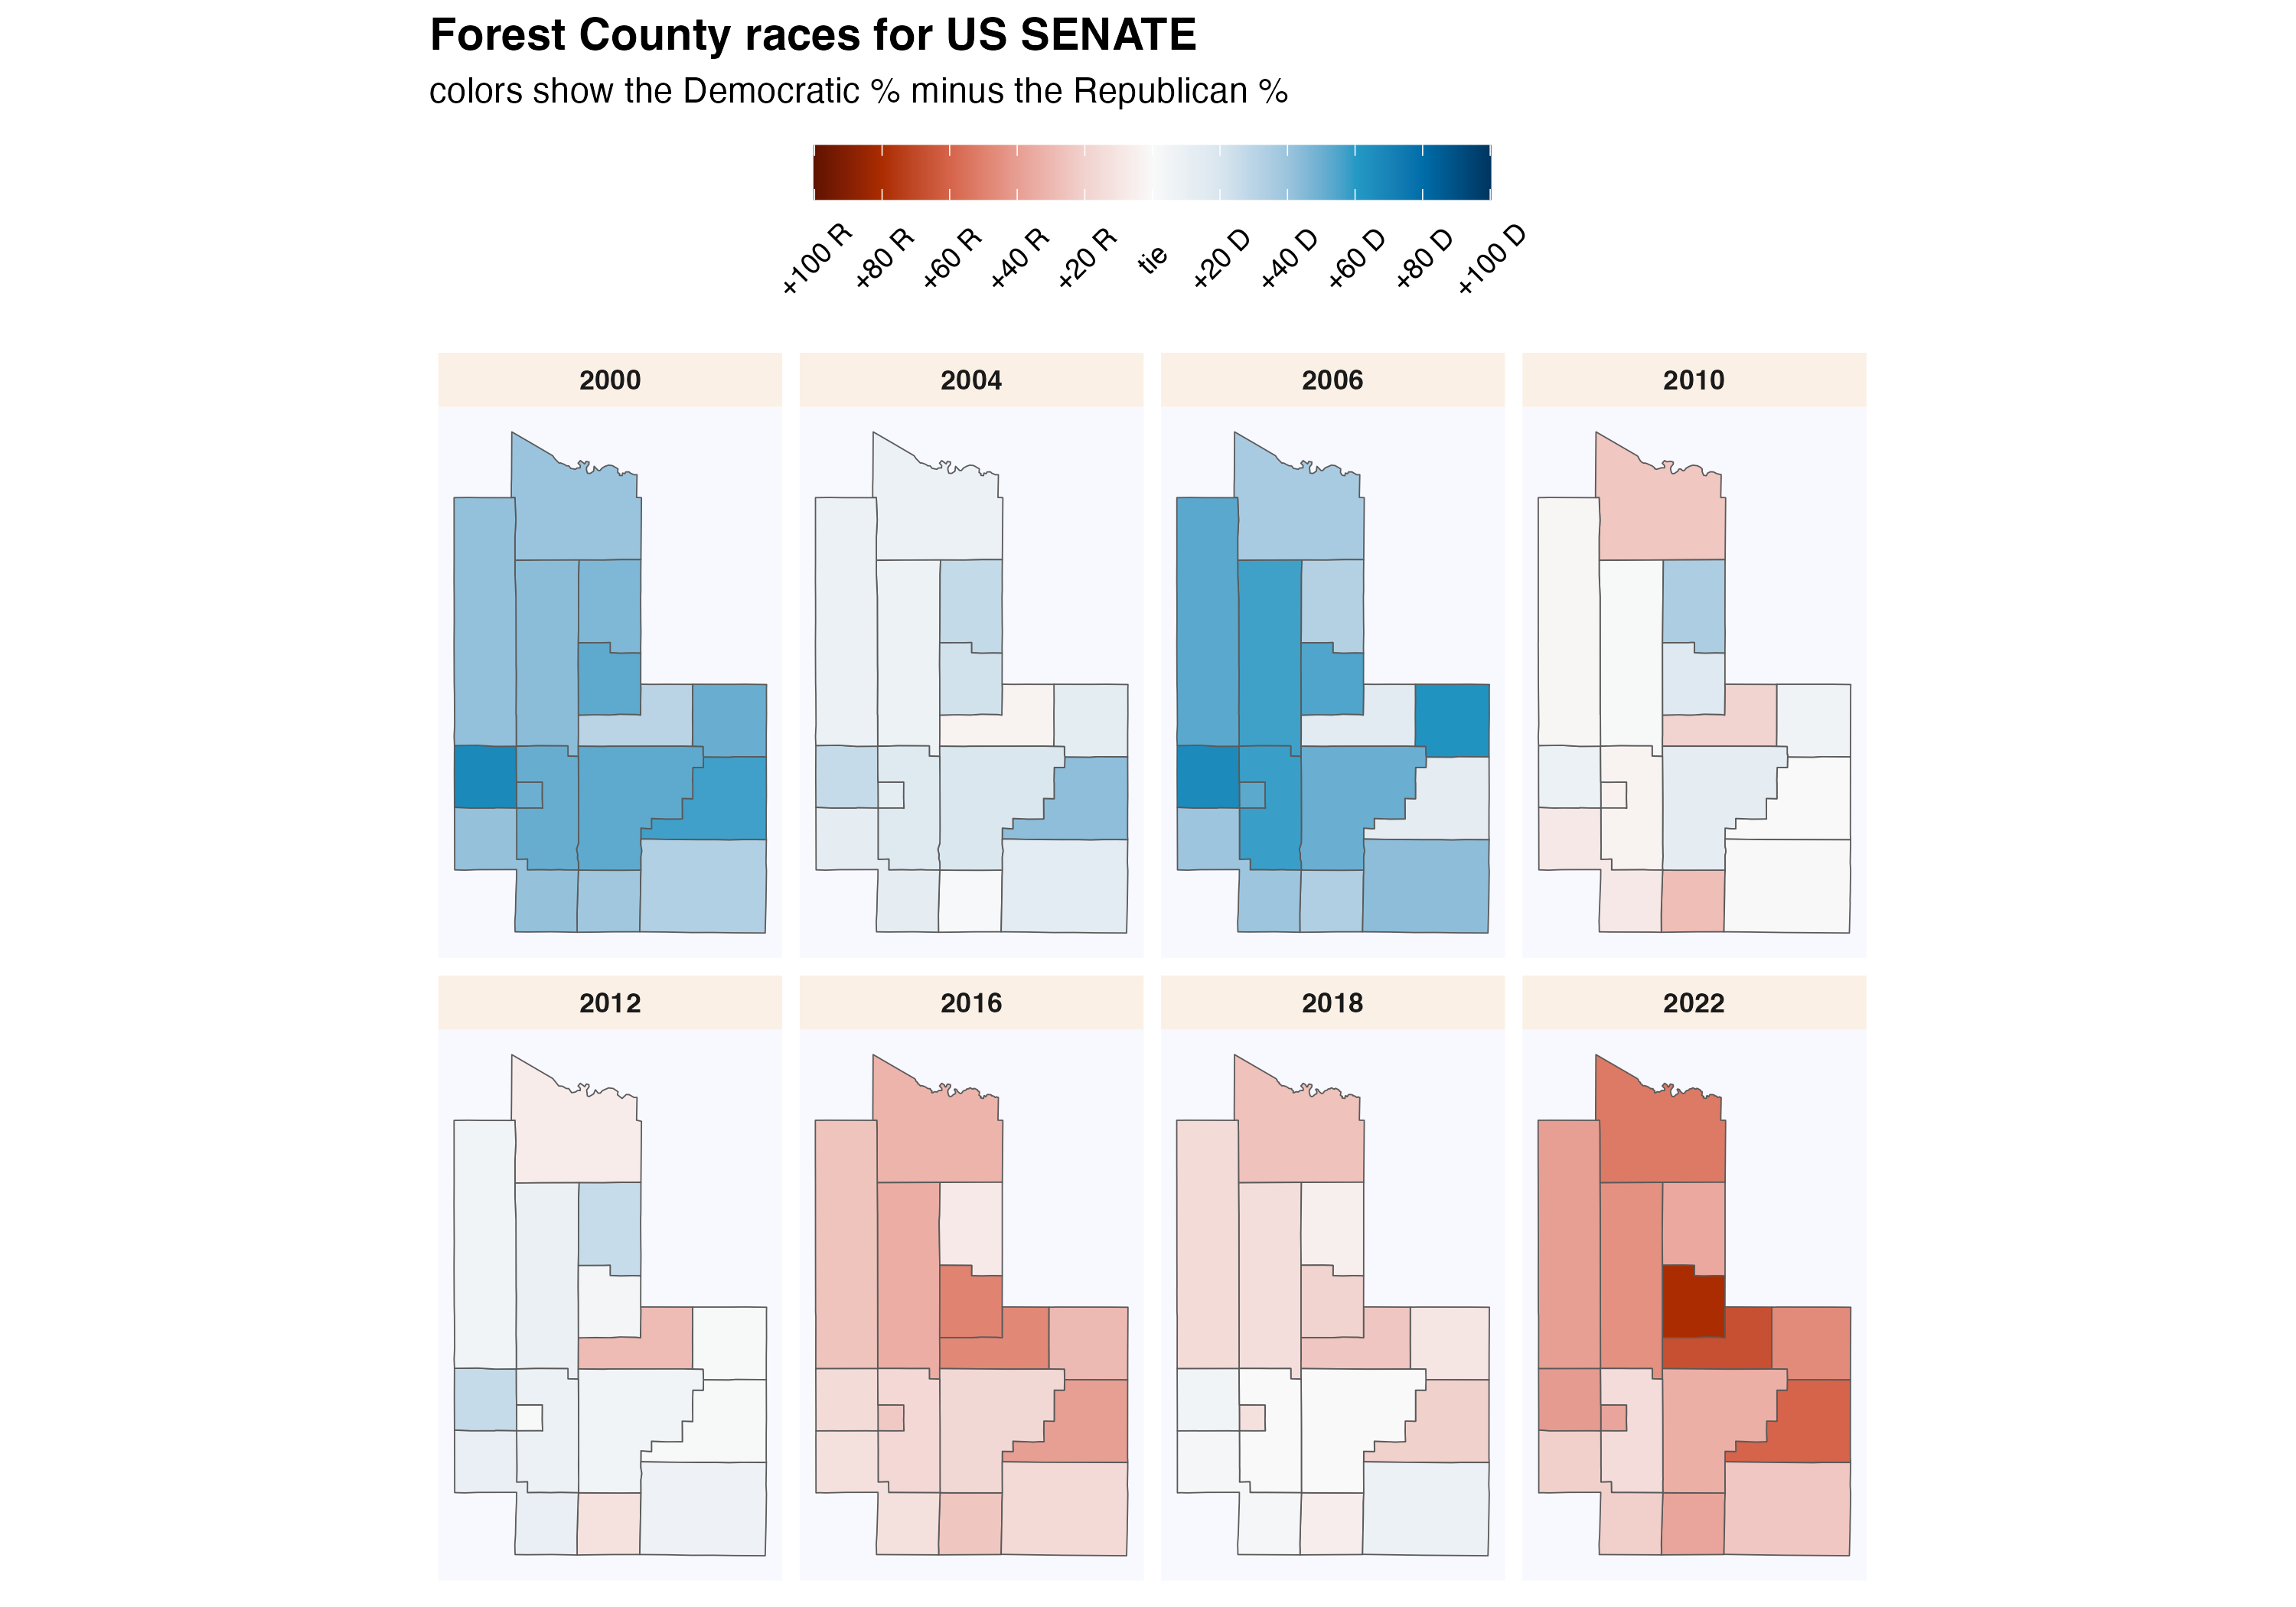
These maps show show every election result since 2000 in each municipality.
Click each column name to sort its values.
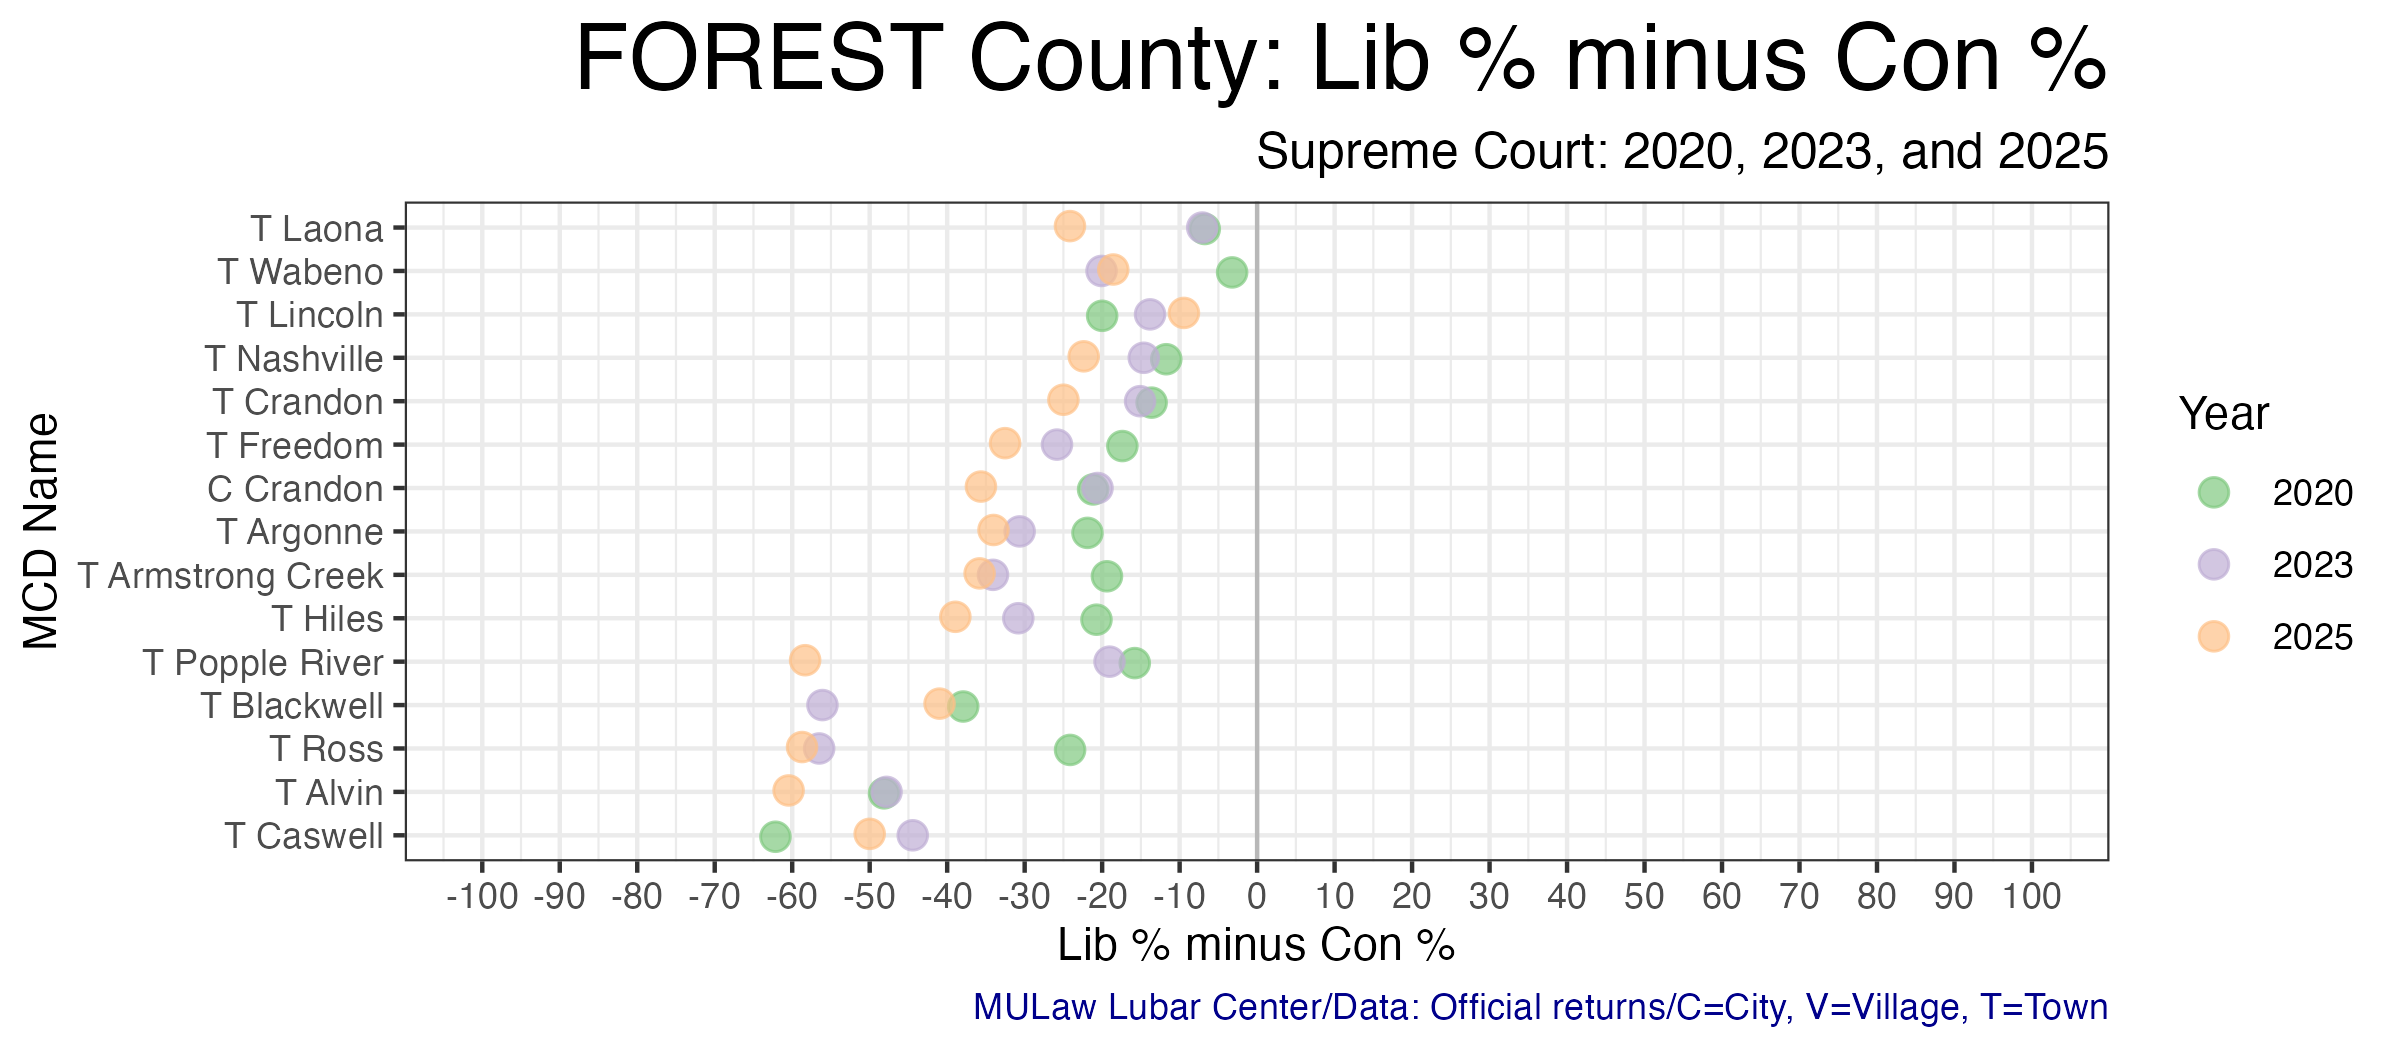
23.4 Supreme Court Election Results
Wisconsin’s Supreme Court has 7 justices, each of whom are elected to 10 year terms in statewide elections held in April. State law prohibits more than one Supreme Court election from being held in a single year. If a seat becomes vacant, the governor appoints a replacement who serves until the next year in which no court election is already scheduled. If more than two candidates achieve ballot access, a nonpartisan, top-two primary is held in February.
Court elections are formally nonpartisan, but candidates are usually supported by either liberals or conservatives. In recent years, it has become common for the Democratic and Republican parties to endorse and actively campaign on behalf of favored judicial candidates. The liberal and conservative labels indicated in the following graphs and tables are based on widely recognized tendencies, not any formal affiliation.
23.4.1 County Election Results
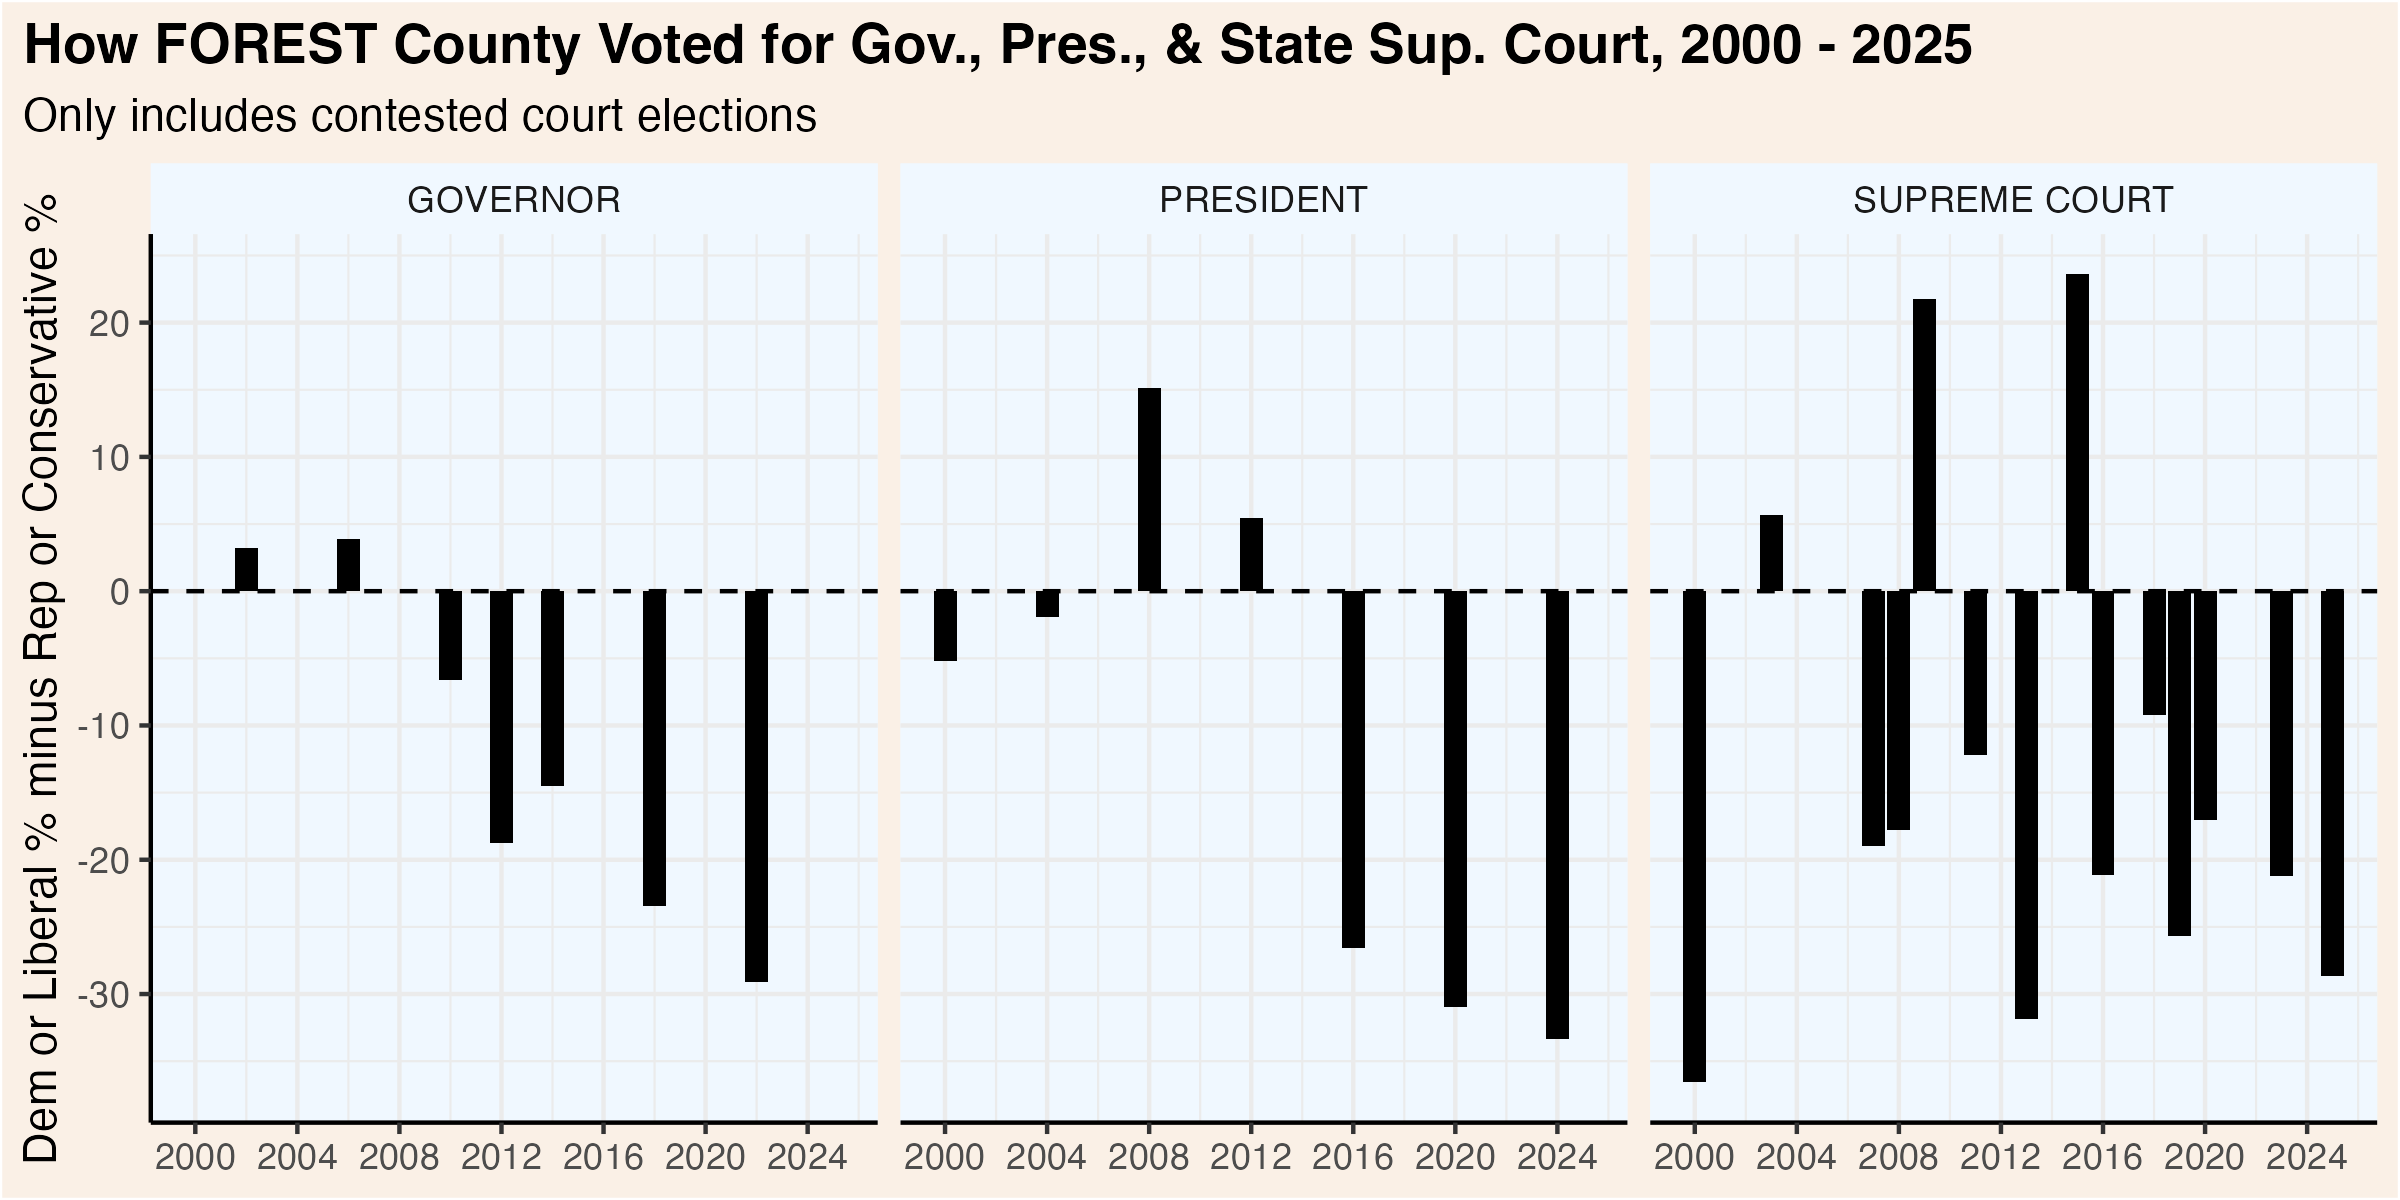
This graphic compares how presidential, gubernatorial, and court elections have trended over the past quarter century. Click the “Table” tab to see detailed results for the Supreme Court races.
23.4.2 Municipality Election Results
The following table shows the results of each Supreme Court election by municipality. The graphic visualizes the shifts over the past three court elections.