60 Shawano
Shawano County (pop. 41,000) is located in northeastern Wisconsin. The population is 85% white and 6% Native American, reflecting the presence of the Stockbridge–Munsee Community. The county’s adult population has relatively low levels of college attainment and slightly lower median incomes than the state as a whole. The county has long leaned Republican and that tilt has grown over recent cycles.
60.1 Demographics

60.2 County Election Results

Click each column name to sort its values.
60.3 Municipality Election Results
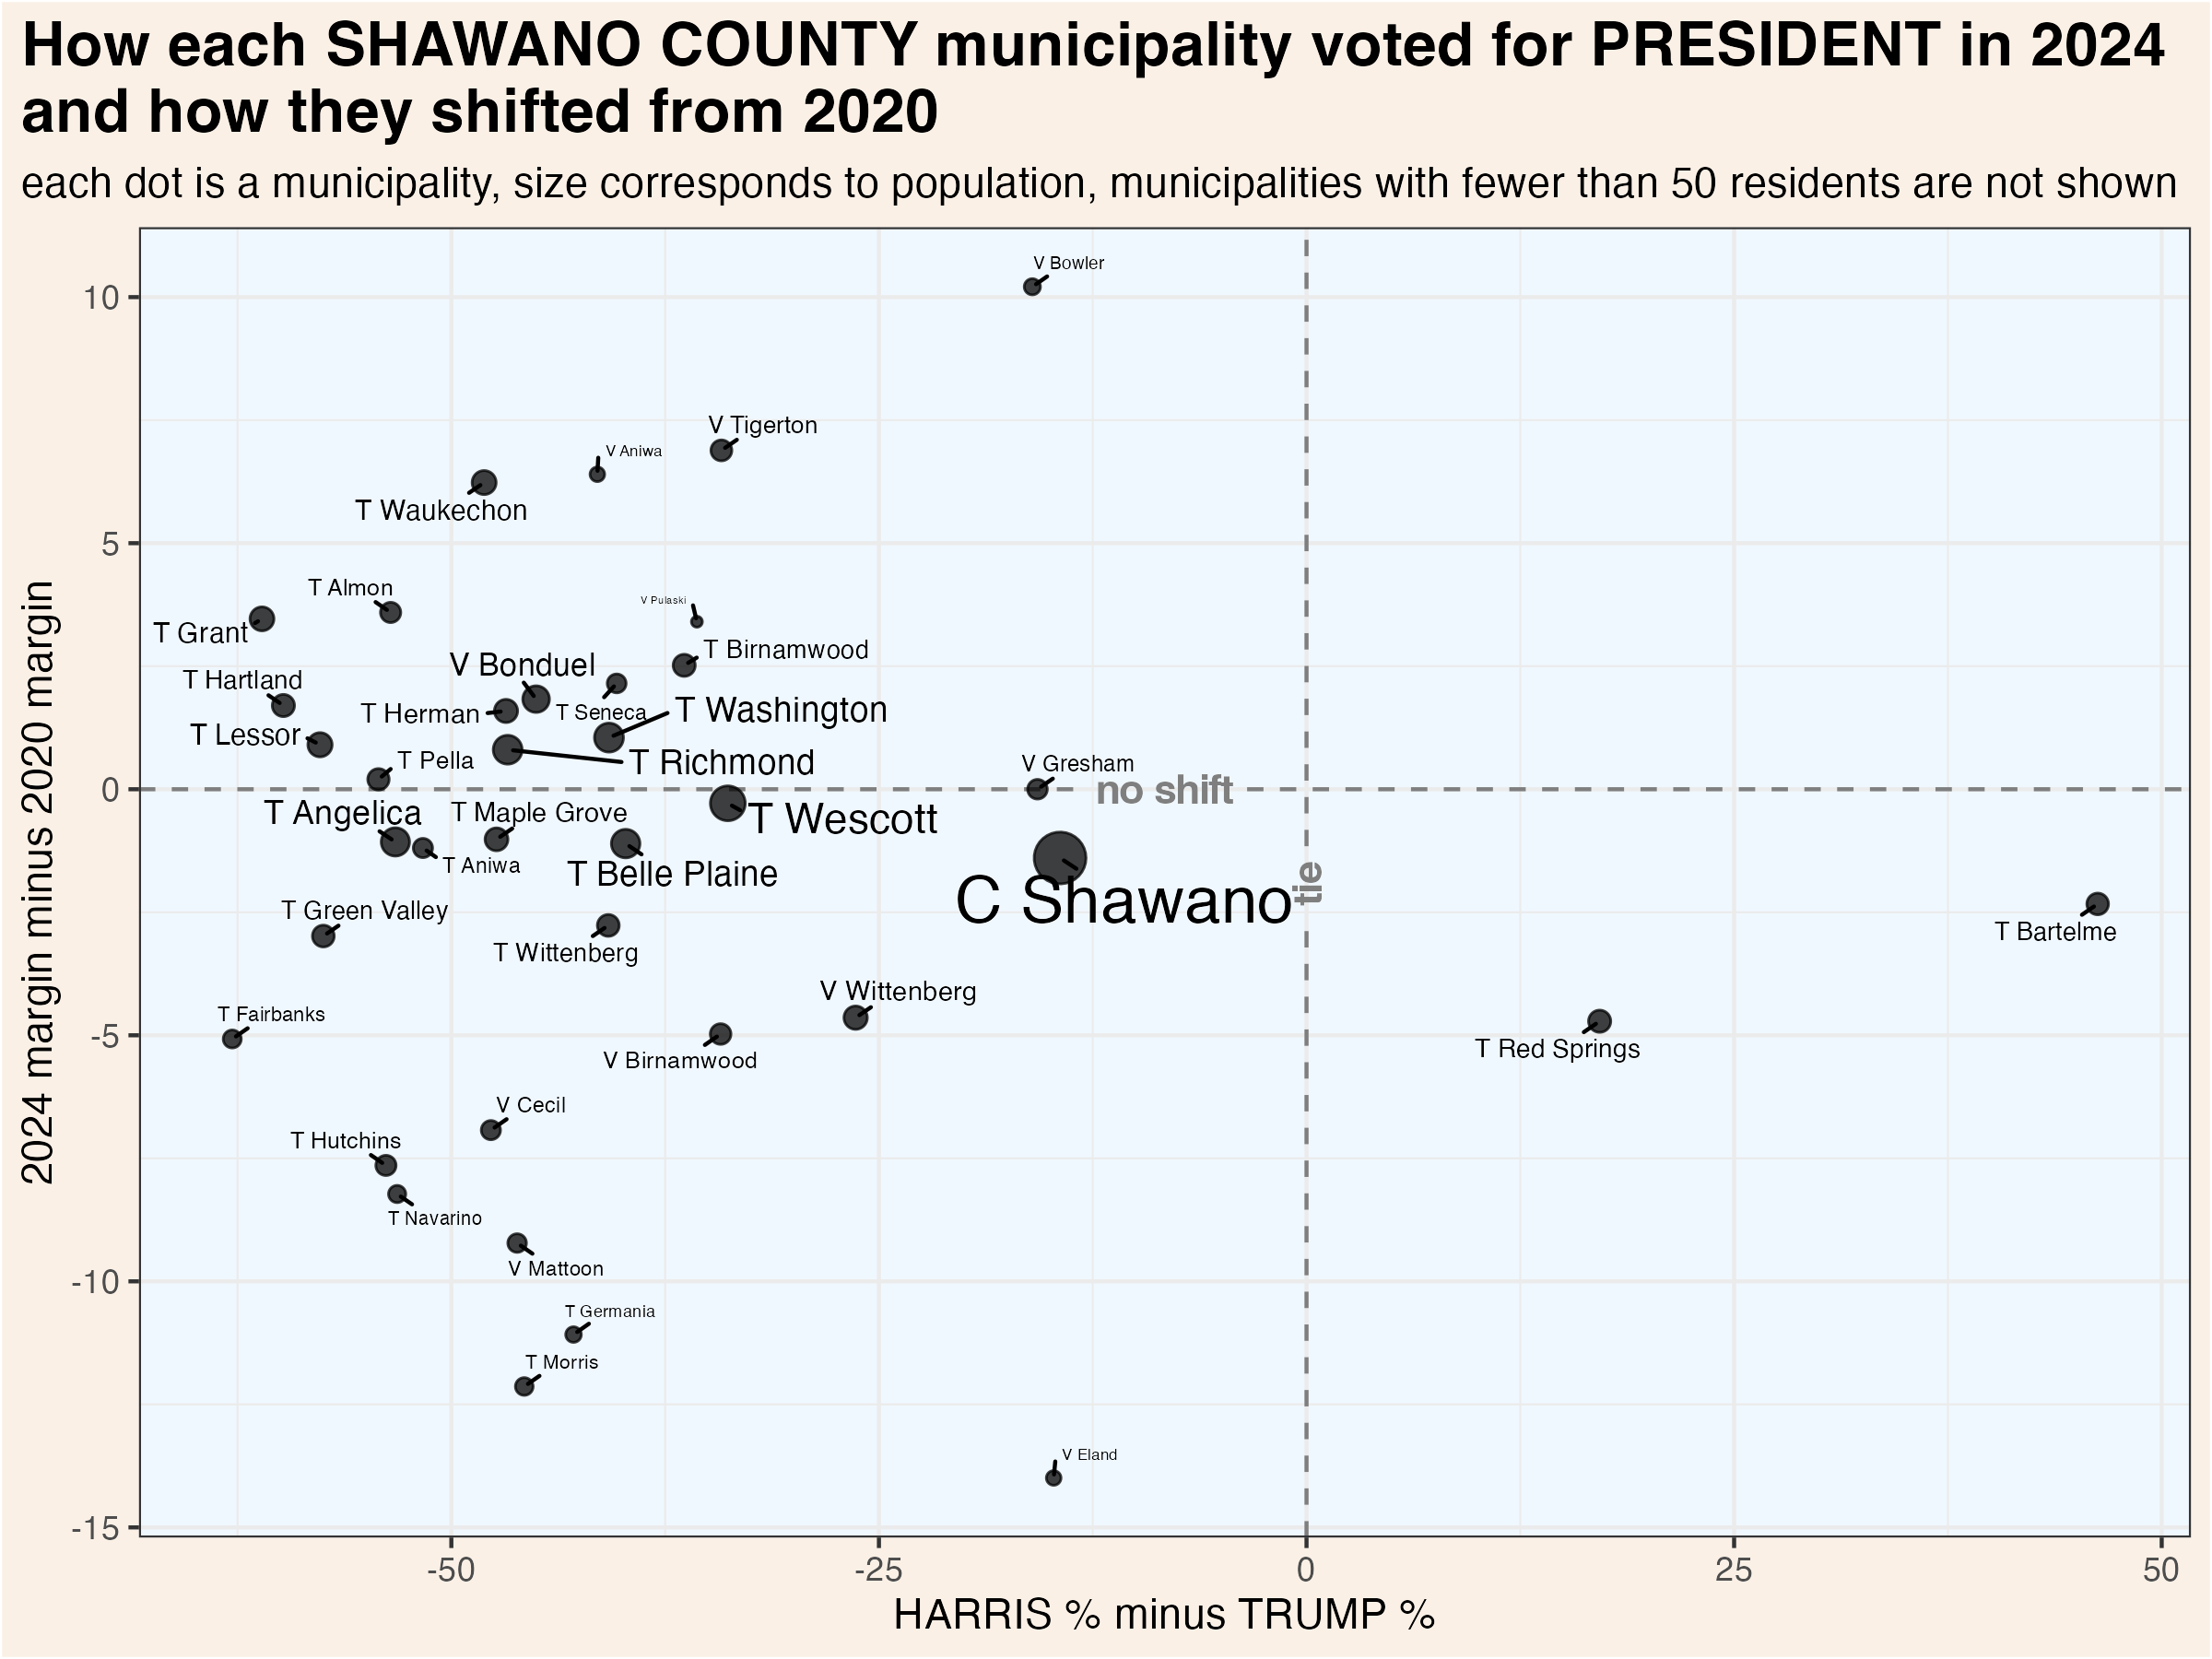
Shawano County’s largest municipality is the City of Shawano. There are 9 other communities with populations between 1,000 and 3,300. The remainder of the population lives in one of the many smaller towns and villages scattered across the county. The City of Shawno, along with most municipalities, leans Republican. The two most Democratic-leaning towns (Bartelme and Red Springs) are small communities with a large Native American population.
This map shows the location of each municipality in the county, as it existed in 2022.

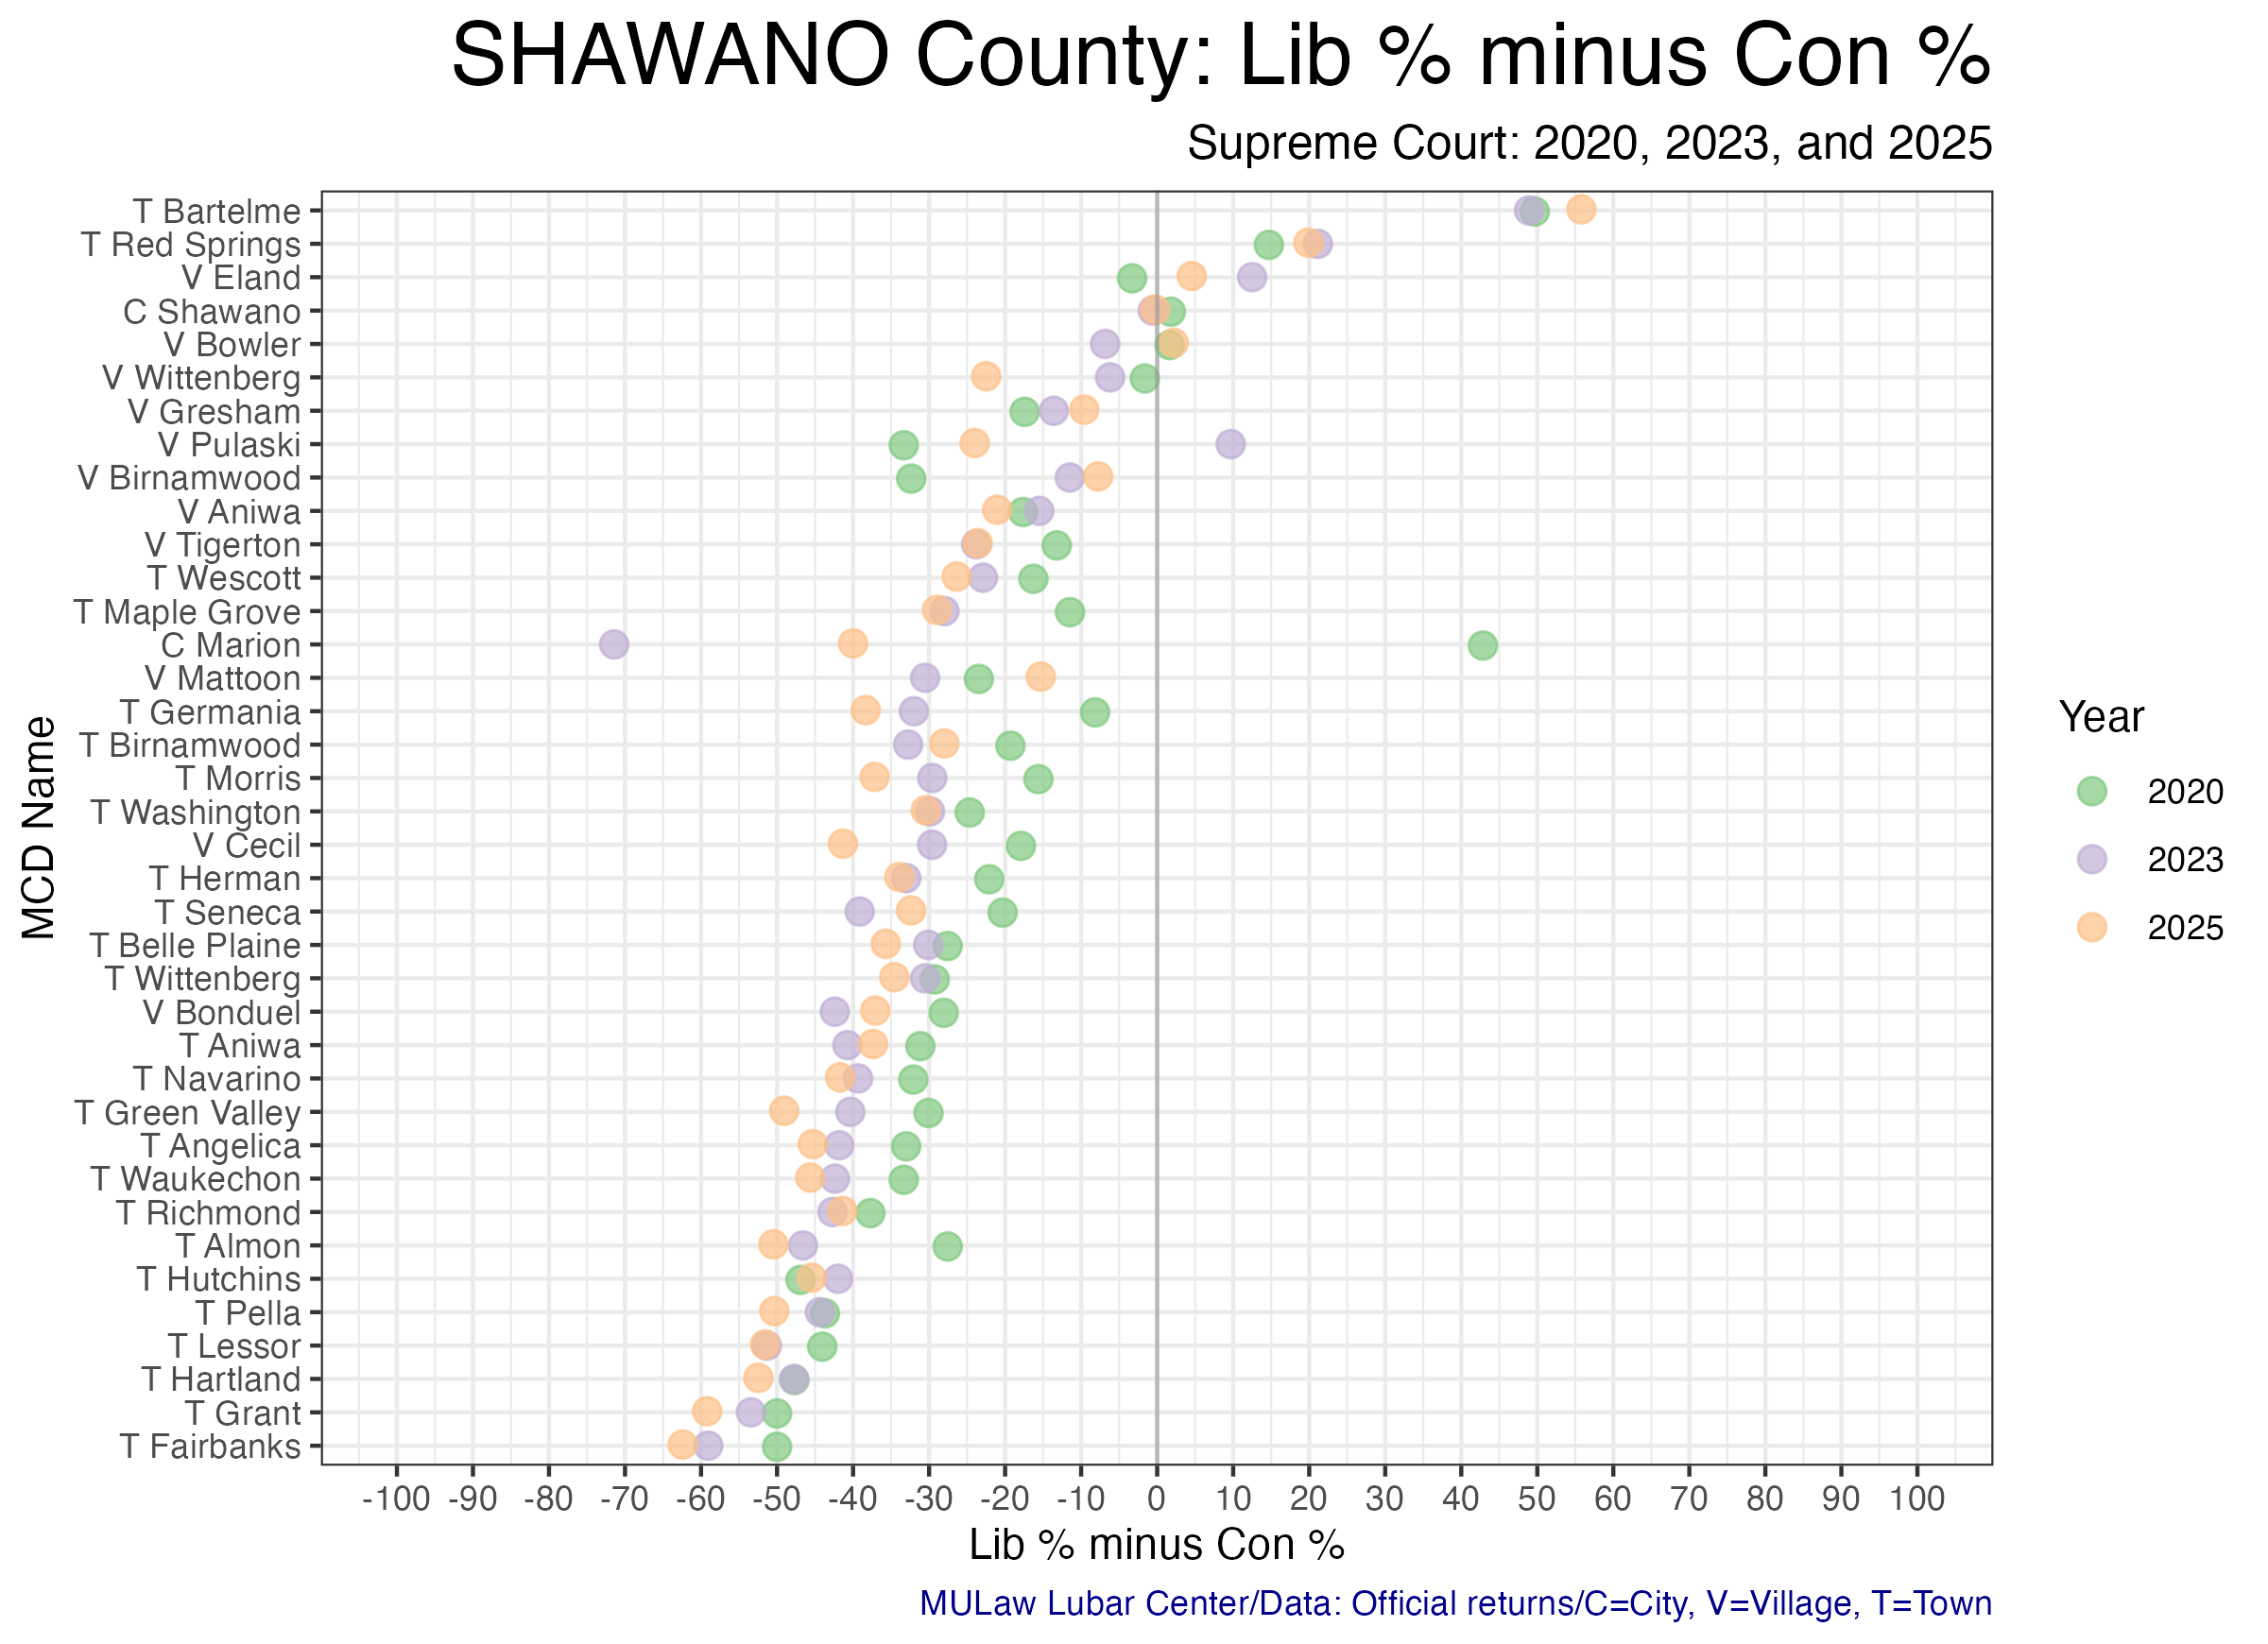
These dot plots show the most recent election results in each municipality.


To more clearly illustrate recent changes in municipality voting trends, these scatterplots compare the most recent vote for president and senator with the shift from that office’s previous election.

These maps show show every election result since 2000 in each municipality.


Click each column name to sort its values.
60.4 Supreme Court Election Results
Wisconsin’s Supreme Court has 7 justices, each of whom are elected to 10 year terms in statewide elections held in April. State law prohibits more than one Supreme Court election from being held in a single year. If a seat becomes vacant, the governor appoints a replacement who serves until the next year in which no court election is already scheduled. If more than two candidates achieve ballot access, a nonpartisan, top-two primary is held in February.
Court elections are formally nonpartisan, but candidates are usually supported by either liberals or conservatives. In recent years, it has become common for the Democratic and Republican parties to endorse and actively campaign on behalf of favored judicial candidates. The liberal and conservative labels indicated in the following graphs and tables are based on widely recognized tendencies, not any formal affiliation.
60.4.1 County Election Results
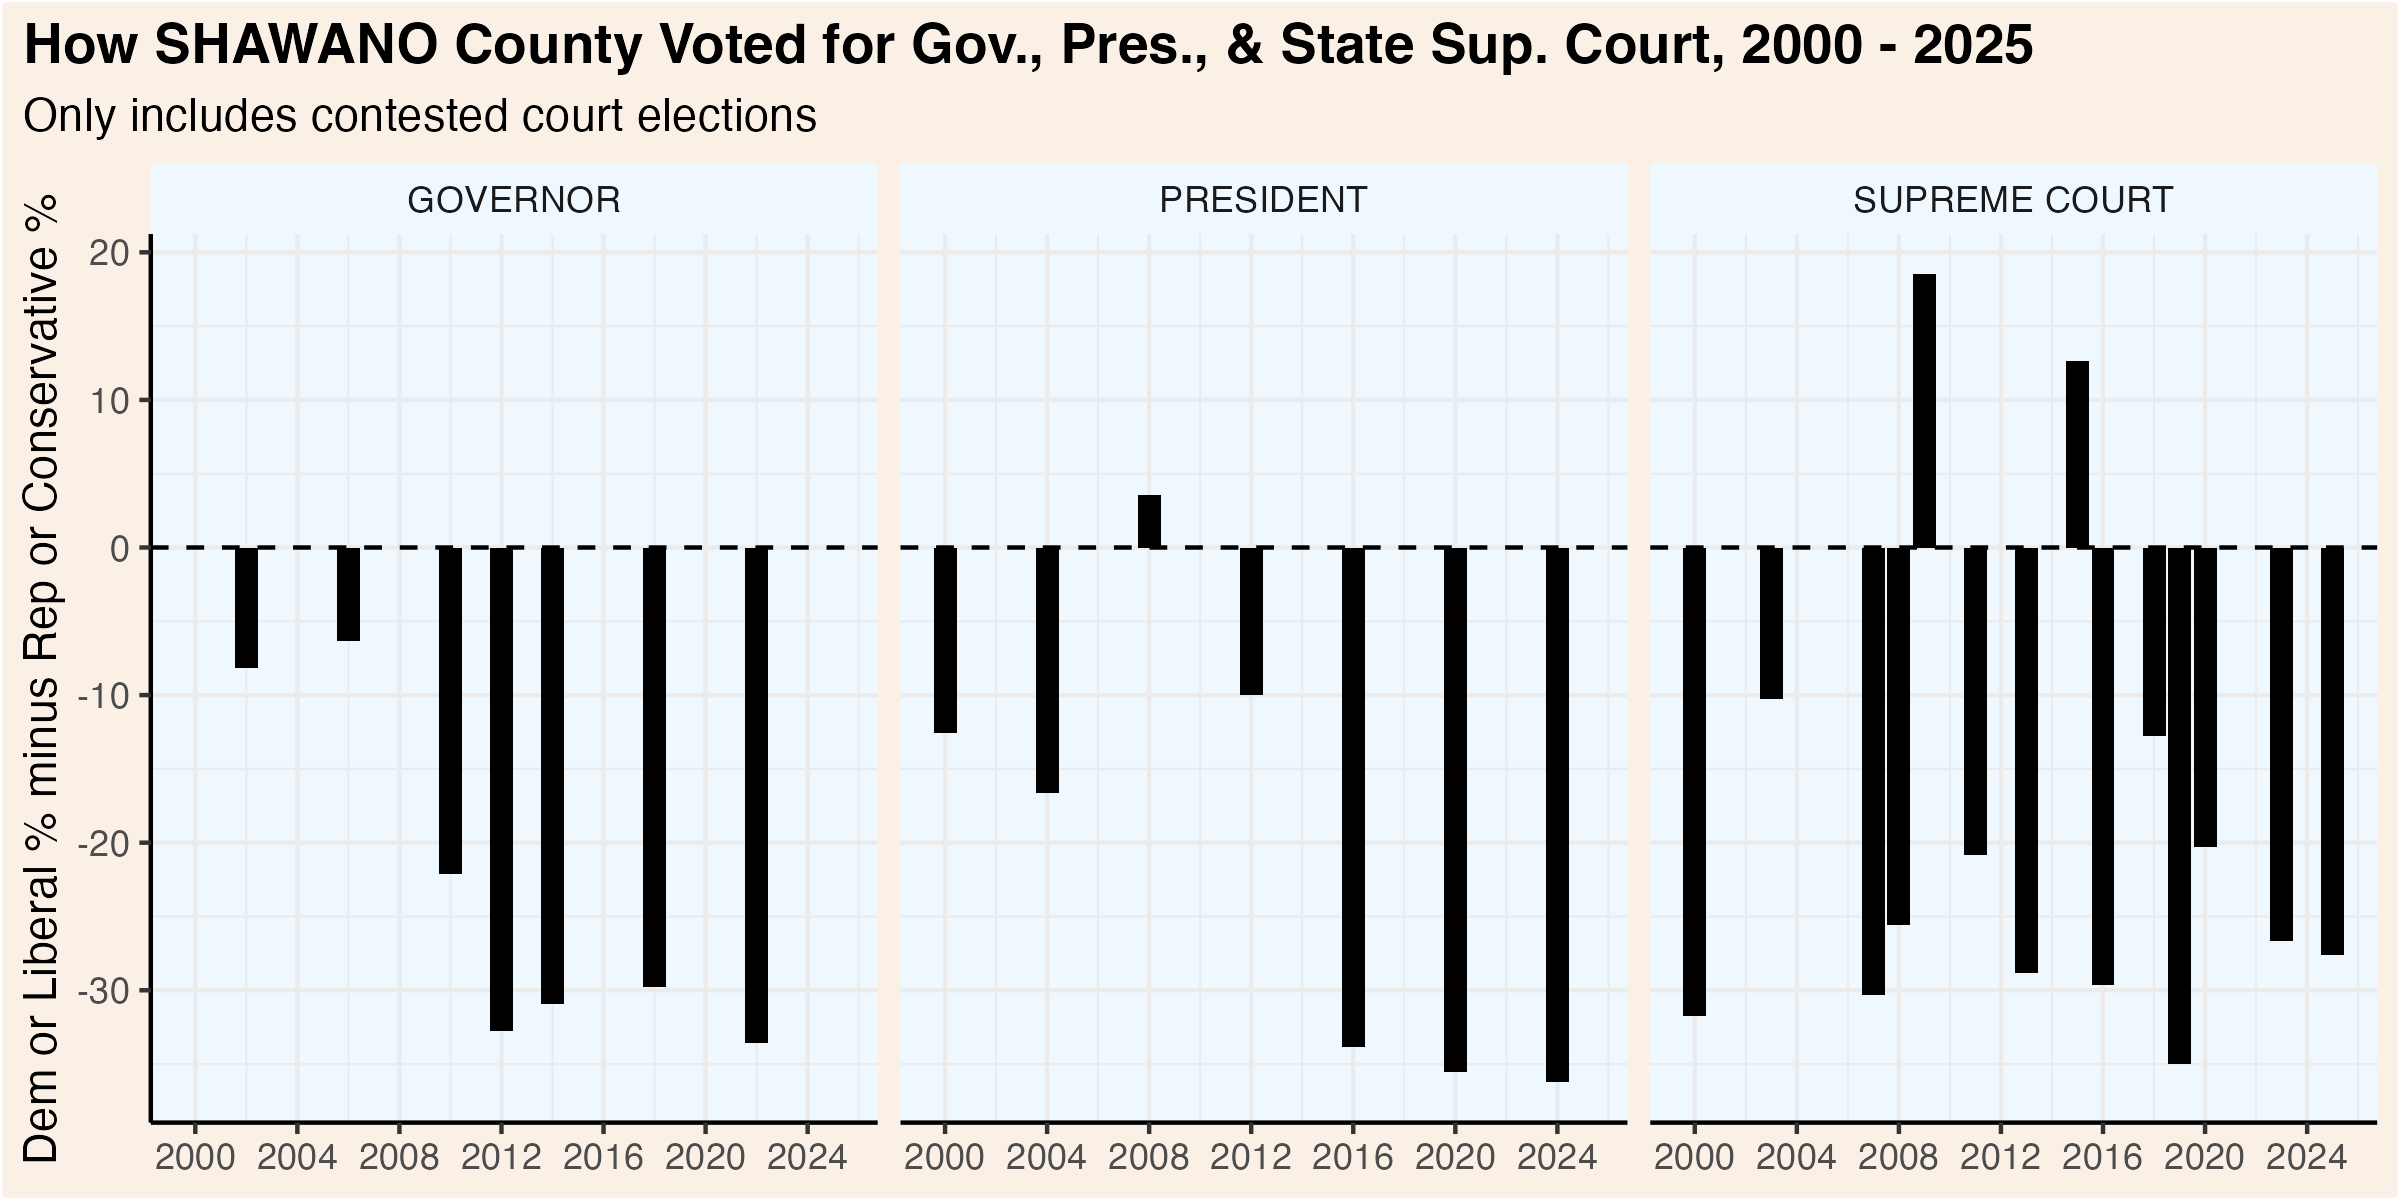
This graphic compares how presidential, gubernatorial, and court elections have trended over the past quarter century. Click the “Table” tab to see detailed results for the Supreme Court races.
60.4.2 Municipality Election Results
The following table shows the results of each Supreme Court election by municipality. The graphic visualizes the shifts over the past three court elections.